For comparable information about infants and toddlers, see Basic Facts About Low-income Children: Children Under 3 Years, 2011, or about young children, see Basic Facts About Low-income Children: Children Under 6 Years, 2011 and Basic Facts About Low-income Children: Children Aged 6 through 11 Years, 2011, or about adolescent children, see Basic Facts About Low-income Children: Children Aged 12 through 17 Years, 2011.
Children represent 24 percent of the population, but they comprise 34 percent of all people in poverty. Among all children under 18 years of age, 45 percent live in low-income families and approximately one in every five (22 percent) live in poor families. Being a child in a low-income or poor family does not happen by chance. There are a range of factors associated with children’s experiences of economic insecurity, including race/ethnicity and parents’ education and employment. This fact sheet describes the demographic, socio-economic, and geographic characteristics of children and their parents. It highlights the important factors that appear to distinguish low-income and poor children from their less disadvantaged counterparts.
How many children under 18 years old in the United States live in low-income families?
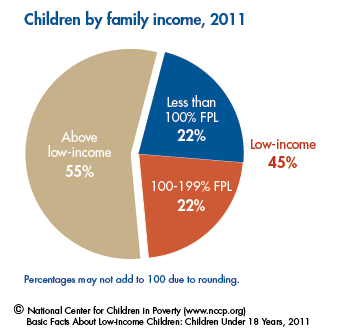
There are more than 72 million children under 18 years old in the United States.
- 45 percent – 32.4 million – live in low-income families.
- 22 percent – 16.1 million – live in poor families.
What was the federal poverty level (FPL) in 2011?
- $22,350 for a family of four.
- $18,530 for a family of three.
- $14,710 for a family of two.
Is a poverty-level income enough to support a family?
Research suggests that, on average, families need an income equal to about two times the federal poverty level to meet their most basic needs. Families with incomes below this level are referred to as low income:
- $44,700 for a family of four.
- $37,060 for a family of three.
- $29,420 for a family of two.
These dollar amounts approximate the average minimum income families need to make ends meet, but actual expenses vary greatly by locality. In 2011, the cost of meeting basic family needs was about $64,000 per year in Los Angeles for a family of four. In 2010, the cost was $57,000 in Newark, N.J., $47,000 in Billings, Mont., and $42,000 in Jackson, Miss.
What is the 2012 federal poverty level (FPL)?
- $23,050 for a family of four.
- $19,090 for a family of three.
- $15,130 for a family of two.
Has the percentage of children living in low-income and poor families changed over time?
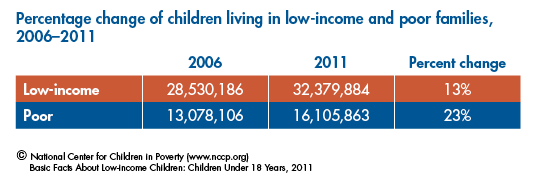
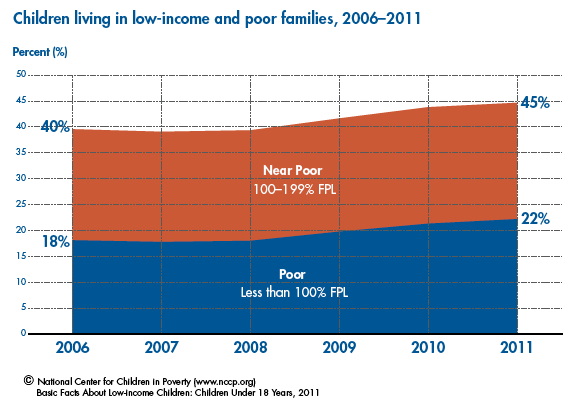
The percentage of children living in low-income families (both poor and near poor) has been on the rise – increasing from 40 percent in 2006 to 45 percent in 2011. During this time period, the overall number of children of all ages increased by less than one percent while the numbers who were low-income and poor increased by 13 percent and 23 percent, respectively.
How do children compare to the rest of the population?
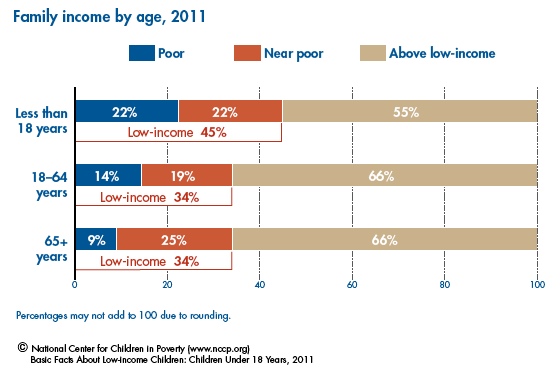
The percentage of all children under 18 years old in low-income families surpasses that of adults. In addition, children are over twice as likely as adults 65 years and older to live in poor families.
Does the percentage of children in low-income families vary by children’s age?
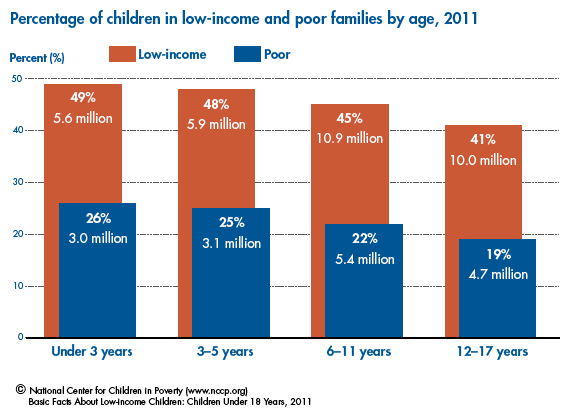
The overall percentages of children living in low-income and poor families mask important variation by age. Although children under 6 years of age represent 33 percent of the population under 18 years, they are disproportionately low income.
- 49 percent of children under 3 years of age – 5.6 million – live in low-income families.
- 48 percent of children 3 through 5 years old – 5.9 million – live in low-income families.
- 45 percent of children 6 through 11 years old – 10.9 million – live in low-income families.
- 41 percent of children 12 through 17 years old – 10 million – live in low-income families.
Does the percentage of children in low-income families vary by race/ethnicity?
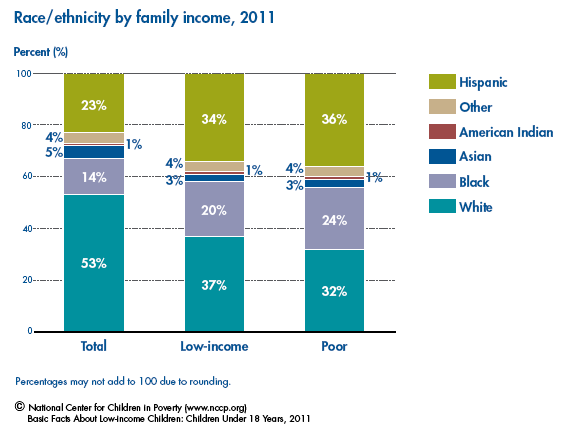
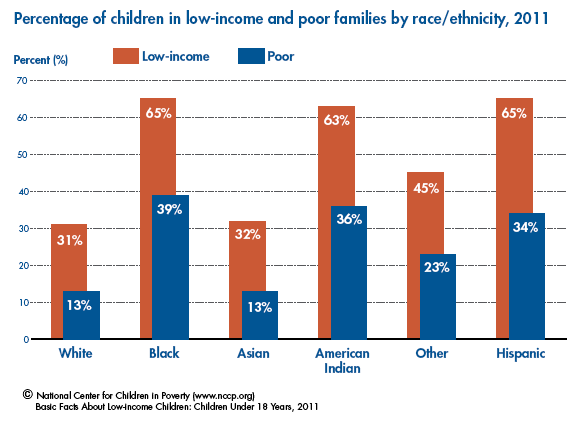
Although black, American Indian, and Hispanic children are disproportionately low income, whites comprise the largest group of all low-income children and Hispanics make up the largest group of poor children under 18 years old.
- 31 percent of white children – 12.1 million – live in low-income families.
- 65 percent of black children – 6.5 million – live in low-income families.
- 32 percent of Asian children – 1 million – live in low-income families.
- 63 percent of American Indian children – 0.4 million – live in low-income families.
- 45 percent of children of some other race – 1.4 million – live in low-income families.
- 65 percent of Hispanic children – 11 million – live in low-income families.
Does the percentage of children in low-income families vary by parents’ country of birth?
- 63 percent of children of immigrant parents – 8.4 million – live in low-income families.
- 41 percent of children of native born parents – 22.6 million – live in low-income families.
What are the family characteristics of low-income and poor children?
Parents’ Education
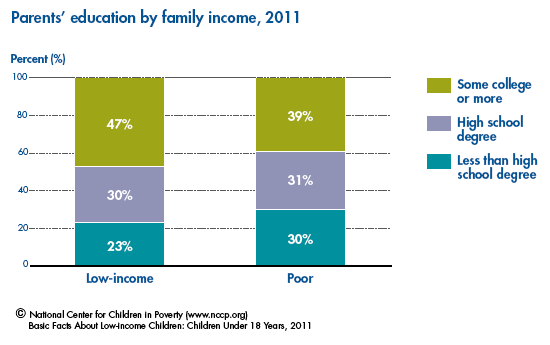
Higher levels of parents’ education decrease the likelihood that a child will live in a low-income or poor family. Yet, 47 percent of low-income children and over one-third (39 percent) of poor children have a parent with at least some college.
- 86 percent of children with parents who have less than a high school degree – 7.4 million – live in low-income families.
- 66 percent of children with parents who have a high school degree but no college – 9.7 million – live in low-income families.
- 31 percent of children with at least one parent who has some college or more education – 15.3 million – live in low-income families.
Parents’ Employment
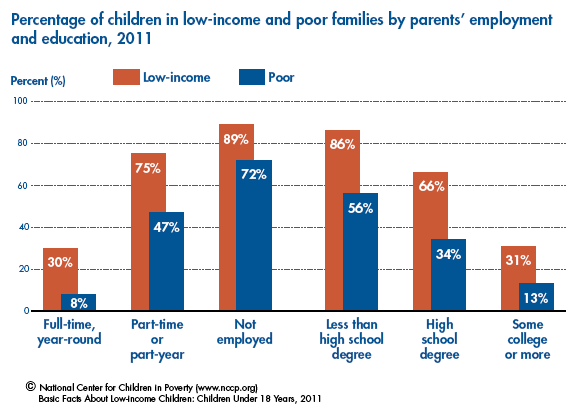
Although children with a full-time, year-round employed parent comprise about 48 percent of the low-income population, they are less likely to be living in a low-income family, compared to children with parents who work part-time/part-year or who are not employed.
- 30 percent of children with at least one parent who works full-time, year-round – 15.4 million – live in low-income families.
- 75 percent of children with at least one parent who works part-time or part-year – 10.4 million – live in low-income families.
- 89 percent of children with no employed parents – 6.5 million – live in low-income families.
Family Structure
About one-half of children (48 percent) in low-income families – 15.5 million – and 37 percent of children in poor families – 6 million – live with married parents.
- 32 percent of all children with married parents – 15.5 million – live in low-income families.
- 70 percent of all children with a single parent – 16.9 million – live in low-income families.
Does the percentage of children in low-income families vary by where they live?
Region
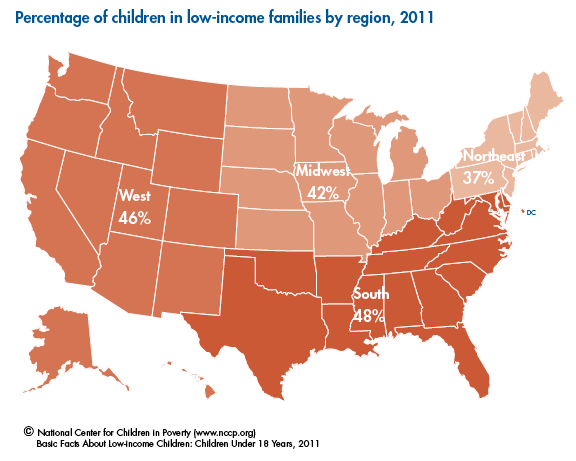
- 37 percent of children in the Northeast – 4.4 million – live in low-income families.
- 42 percent of children in the Midwest – 6.6 million – live in low-income families.
- 48 percent of children in the South – 13.2 million – live in low-income families.
- 46 percent of children in the West – 8.1 million – live in low-income families.
Type of Area
Similarly, children living in rural areas are more likely to live in low-income families compared to those living in urban areas.
- 43 percent of children in urban areas – 24.5 million – live in low-income families.
- 52 percent of children in rural areas – 5.7 million – live in low-income families.
Residential Instability and Home Ownership
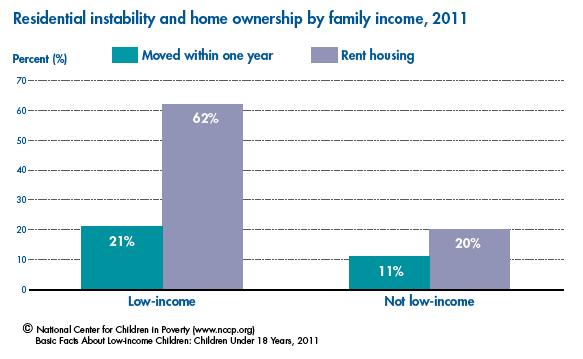
Research suggests that stable housing is important for healthy child development. However, children living in low-income families are twice as likely as other children to have moved in the past year and three times as likely to live in families that rent a home.
- 21 percent of children in low-income families – 6.9 million – moved in the last year.
- 11 percent of children in families with higher income – 4.3 million – moved in the last year.
- 62 percent of children in low-income families – 20 million – live with a family that rents a home.
- 20 percent of children in families with higher income – 8.1 million – live with a family that rents a home.
Are children in low-income families covered by health insurance?
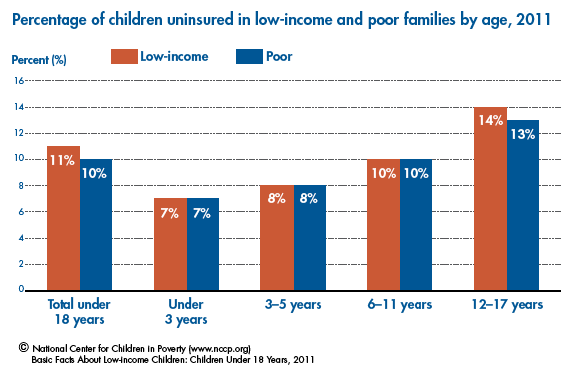
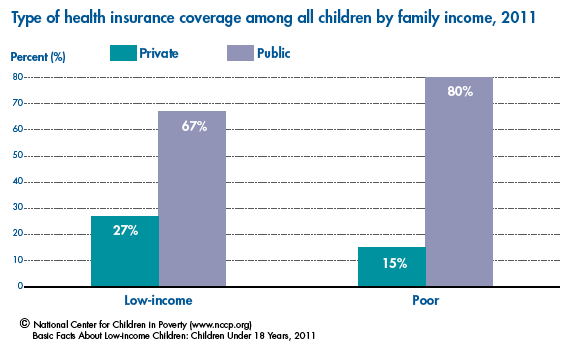
Among all children under 18 years of age, approximately 11 percent in low-income families and 10 percent in poor families are without health insurance coverage. Consistent with research suggesting older children in general are particularly at risk of being uninsured, children 12 through 17 years old in low-income and poor families are more likely to be uninsured compared to younger children in low-income and poor families.11 Public insurance reaches the largest share of economically disadvantaged children, covering 67 percent of low-income children and 80 percent of poor children.
- 11 percent of children living in low-income families – 3.4 million – are uninsured.
- 27 percent of children living in low-income families – 8.9 million – are covered by private insurance.
- 67 percent of children living in low-income families – 21.6 million – are covered by public insurance.
Endnotes
This fact sheet is part of the National Center for Children in Poverty’s demographic fact sheet series and is updated annually. However, estimates published in this year’s fact sheet are not directly comparable with earlier years, as the data analyzed have changed from the Current Population Survey (used in previous years) to the American Community Survey (ACS). Unless otherwise noted, analysis of the 2011 American Community Survey (ACS) was conducted by Sophia Addy of NCCP. Yumiko Aratani provided feedback that contributed to the analysis. Estimates include children living in households with at least one parent and most children living apart from both parents (for example, children being raised by grandparents). Children living independently, living with a spouse, or in group quarters are excluded from these data. Children ages 14 and under living with only unrelated adults were not included because data on their income status were not available. Among children who do not live with at least one parent, parental characteristics are those of the householder and/or the householder’s spouse. Special thanks to Morris Ardoin, Amy Palmisano, and Telly Valdellon.
1. In this fact sheet, poverty is defined as family income less than 100 percent of the poverty threshold; low income is defined as family income less than 200 percent of the poverty threshold.
2. These numbers are from the federal poverty guidelines issued annually by the U.S. Department of Health and Human Services. The demographic findings in this fact sheet were calculated using more complex versions of the federal poverty measure – the thresholds issued by the U.S. Census Bureau. Please see http://aspe.hhs.gov/poverty/11poverty.shtml for the 2011 poverty thresholds. For more information on measuring poverty and the differences between the federal poverty guidelines and the thresholds, see the U.S. Department of Health and Human Services website.
3. Cauthen, N. K., & Fass, S. (2008). Measuring income and poverty in the United States. New York, NY: National Center for Children in Poverty, Columbia University, Mailman School of Public Health.
4. These figures were derived from NCCP’s Basic Needs Budget Calculator.
5. In the most recent ACS, parents could report children’s race as one or more of the following: “White,” “Black,” “American Indian or Alaska Native,” or “Asian and/or Hawaiian/Pacific Islander.” In a separate question, parents could report whether their children were of Hispanic origin. For the data reported, children whose parent reported their race as White, Black, American Indian or Alaska Native, or Asian and/ or Hawaiian/Pacific Islander and their ethnicity as non-Hispanic are assigned their respective race. Children who were reported to be of more than one race were assigned as Other. Children whose parent identified them as Hispanic were categorized as Hispanic, regardless of their reported race.
6. Children living in households with one immigrant parent and one native-born parent (approximately 4.1 million) are not included in these estimates.
7. Parent’s education is the education level of the most highly educated parent living in the household. Parents can either have no high school degree; a high school degree, but no college; or some college or more.
8. Parent’s employment is the employment level of the parent in the household who maintained the highest level of employment in the previous year. Parents can either have no employment in the previous year, part-year or part-time employment, or full-time, year-round employment. Part-year or part-time employment is defined as either working less than 50 weeks in the previous year or less than 35 hours per week. Full-time, year-round employment is defined as working at least 50 weeks in the previous year and 35 hours or more per week for more than half the year.
9. Aratani, Y. (2009). Homeless children and youth. New York, NY: National Center for Children in Poverty, Columbia University, Mailman School of Public Health.
10. People can report more than one type of insurance coverage. Children not covered by private or public health insurance at the time of the survey are considered uninsured.
11. Schwarz, S. W. (2009). Adolescent mental health in the United States. New York, NY: National Center for Children in Poverty, Columbia University, Mailman School of Public Health.