2008 is the most recent year for which data are available.
How many households have food insecurity among children?
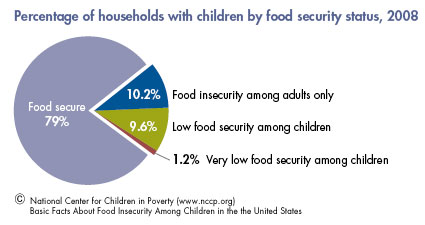
There are about 39.5 million households with children (approximately 34 percent of all households).
- 79 percent were food secure.
- 10.2 percent reported food security among adults only.
- 9.6 percent reported low food security among children.
- 1.2 percent reported very low food security among children.
How have these numbers changed over time?
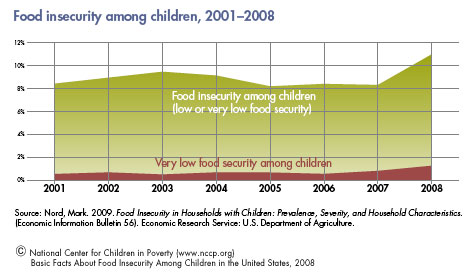
The prevalence of food insecurity among children rose sharply in 2008 to about 11 percent after remaining between 8 and 9.5 percent for nearly a decade.
Measuring Food Insecurity in the United States
According to the U.S. Department of Agriculture (USDA), food security is defined as having, “dependable access to enough food for active, healthy living.” Conversely, food insecurity, or the lack of consistent access to adequate food, means that the “the food intake of one or more household members was reduced and their eating patterns were disrupted at times during the year because the household lacked money and other resources for food.” The USDA classifies households by the level of food insecurity they have experienced (for example, low or very low food security). The food insecurity status of households with children is further classified by whether it affects only adults or whether it affects children and by the level of food insecurity among the children.
Estimates of food insecurity in this report are based on a set of 18 questions fielded in the Food Security Supplement of the Current Population Survey. Following the guidelines outlined by the USDA, households are food insecure if they respond affirmatively to at least three of the 18 questions. Children’s food security status in the household is based on responses to questions 11 to 18, which asks the main respondent in the household to report on the food security of children. Households reporting between two and four indicators of food insecurity were classified as having low food security among children. Households responding affirmatively on five or more questions are classified as having very low food security among children. The classification food insecurity among children includes both categories. The households’ food security classification generally reflects the most severe food insecurity they experienced during the year.
Questions from the CPS Food Security Supplement
- “We worried whether our food would run out before we got money to buy more.” Was that often, sometimes, or never true for you in the last 12 months?
- “The food that we bought just didn’t last and we didn’t have money to get more.” Was that often, sometimes, or never true for you in the last 12 months?
- “We couldn’t afford to eat balanced meals.” Was that often, sometimes, or never true for you in the last 12 months?
- In the last 12 months, did you or other adults in the household ever cut the size of your meals or skip meals because there wasn’t enough money for food? (Yes/No)
- (If yes to Question 4) How often did this happen – almost every month, some months but not every month, or in only 1 or 2 months?
- In the last 12 months, did you ever eat less than you felt you should because there wasn’t enough money for food? (Yes/No)
- In the last 12 months, were you ever hungry, but didn’t eat, because there wasn’t enough money for food? (Yes/No)
- In the last 12 months, did you lose weight because there wasn’t enough money for food? (Yes/No)
- In the last 12 months did you or other adults in your household ever not eat for a whole day because there wasn’t enough money for food? (Yes/No)
- (If yes to Question 9) How often did this happen – almost every month, some months but not every month, or in only 1 or 2 months?
- “We relied on only a few kinds of low-cost food to feed our children because we were running out of money to buy food.” Was that often, sometimes, or never true for you in the last 12 months?
- “We couldn’t feed our children a balanced meal, because we couldn’t afford that.” Was that often, sometimes, or never true for you in the last 12 months?
- “The children were not eating enough because we just couldn’t afford enough food.” Was that often, sometimes, or never true for you in the last 12 months?
- 14. In the last 12 months, did you ever cut the size of any of the children’s meals because there wasn’t enough money for food? (Yes/No)
- In the last 12 months, were the children ever hungry but you just couldn’t afford more food? (Yes/No)
- In the last 12 months, did any of the children ever skip a meal because there wasn’t enough money for food? (Yes/No)
- (If yes to Question 16) How often did this happen – almost every month, some months but not every month, or in only 1 or 2 months?
- In the last 12 months did any of the children ever not eat for a whole day because there wasn’t enough money for food? (Yes/No)
What are the characteristics of households with food insecurity among children?
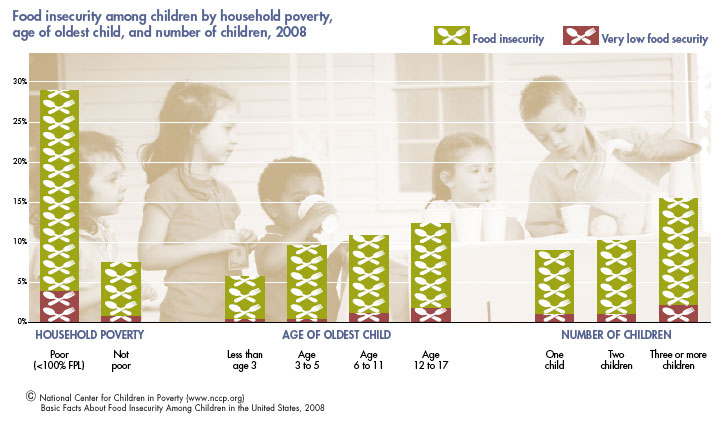
Despite nutrition policies and food benefits targeting children and families in need, household food insecurity among children is nearly four times more common among poor households than among nonpoor households.
- 28.9 percent of poor households report food insecurity among children.
- 7.5 percent of nonpoor households report food insecurity among children.
Unlike poverty, which hits young children the hardest, food insecurity appears to be more prevalent in households with older children.
- 5.7 percent of households with an oldest child less than age three report food insecurity among children.
- 9.6 percent of households with an oldest child aged 3 to 5 report food insecurity among children.
- 10.9 percent of households with an oldest child aged 6 to 11 report food insecurity among children.
- 12.2 percent of households with an oldest child aged 12 to 17 report food insecurity among children.
Food insecurity is higher among households with more children.
- 9 percent of households with one child report food insecurity among children.
- 10.2 percent of households with two children report food insecurity among children.
- 15.5 percent of households with three or more children report food insecurity among children.
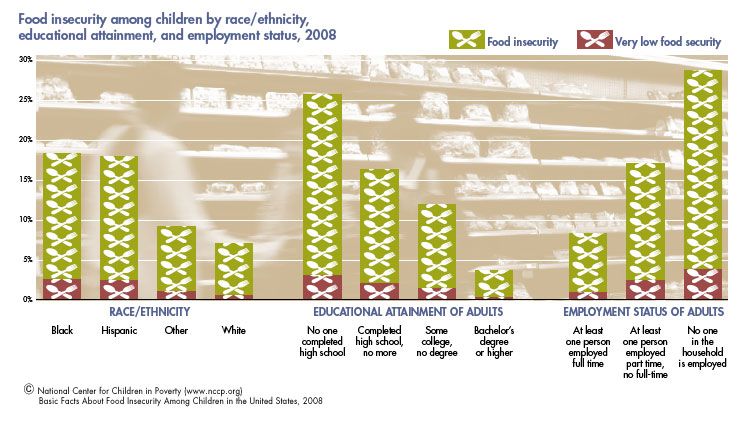
Households headed by black and Hispanic individuals are twice as likely as households headed by white individuals or persons of some other race to report food insecurity among children.
- 18.3 percent of black-headed households report food insecurity among children.
- 18 percent of Hispanic-headed households report food insecurity among children.
- 9.2 percent of households headed by persons of some other race report food insecurity among children.
- 7.1 percent of white-headed households report food insecurity among children.
The difference in food insecurity among children by the educational attainment of household adults is striking. Households where no one has a high school degree are nearly seven times more likely to report food insecurity among children than households where at least one adult has a bachelor’s degree.
- 25.8 percent of households where no one has a high school degree report food insecurity among children.
- 16.4 percent of households where the most highly educated adult has a high school diploma, but no more, report food insecurity among children.
- 12 percent of households where the most highly educated adult has some college, but no degree, report food insecurity among children.
- 3.7 percent of households where the most highly educated adult has a bachelor’s degree or more, report food insecurity among children.
Employment, particularly full-time work, may help to minimize the risk of experiencing food insecurity among children. Children residing in households where at least one adult is working full time are about 3.5 times less likely to experience food insecurity compared with children in households where no one is employed.
- 8.3 percent of households where at least one member is employed full time report food insecurity among children.
- 17.2 percent of households where at least one member is employed part time, but no one is employed full time report food insecurity among children.
- 28.7 percent of households where no one is employed report food insecurity among children.
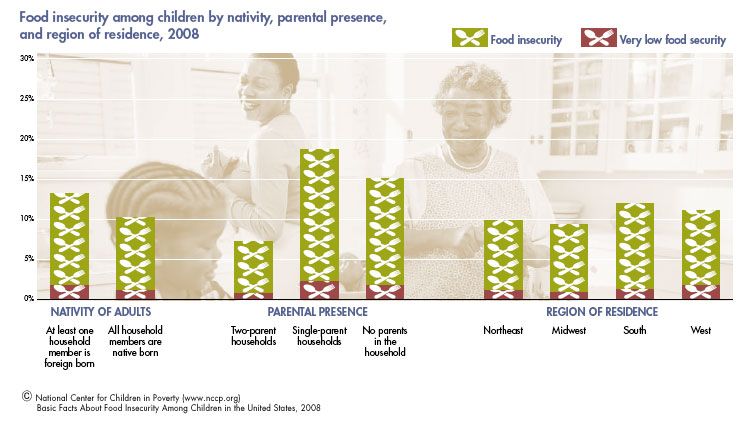
Food insecurity among children is higher in households where at least one member is foreign born.
- 13.2 percent of households where at least one member is foreign born report food insecurity among children.
- 10.1 percent of households where all members are native born report food insecurity among children.
Having two parents present in the household appears to shield children from experiencing food insecurity.
- 7.2 percent of two-parent households report food insecurity among children.
- 18.7 percent of single-parent households report food insecurity among children.
- 15.1 percent of households with children where no parent is present report food insecurity among children.
The southern region leads the nation in the percentage of households with food insecurity among children.
- 9.8 percent of households in the Northeast report food insecurity among children.
- 9.3 percent of households in the Midwest report food insecurity among children.
- 12 percent of households in the South report food insecurity among children.
- 11.1 percent of households in the West report food insecurity among children.
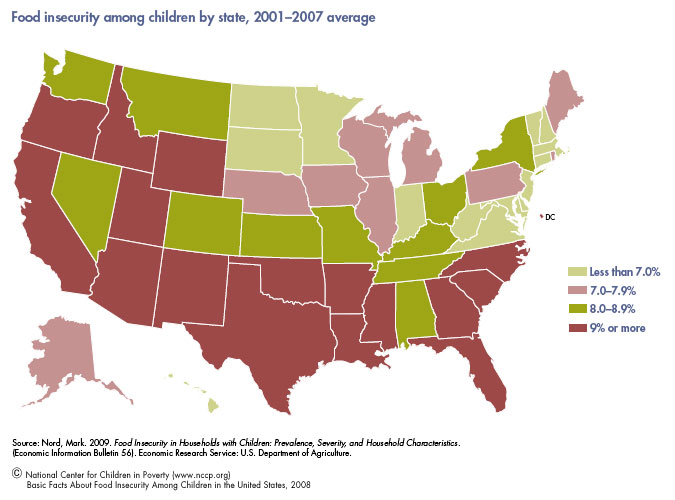
The percentage of households with food insecurity among children varies by state. Texas had the highest percentage of food insecurity among children (12.6 percent). Three additional states had rates of food insecurity among children that were above 11 percent: Arizona (11.2 percent), Mississippi (11.3 percent), New Mexico (12.4 percent). The states with the lowest rates of food insecurity among children were New Hampshire (4.8 percent), North Dakota (5.3 percent), and Minnesota (5.7 percent).
Percentage of households with food insecurity among children by selected characteristics, 2008 (numbers are in thousands)
| FOOD INSECURITY AMONG CHILDREN | VERY LOW FOOD SECURITY AMONG CHILDREN | ||||
| N | N | % | N | % | |
| Total households with children | 39,561 | 4,278 | 10.8 | 490 | 1.2 |
| Annual household income | |||||
| Poor | 5,935 | 1,717 | 28.9 | 231 | 3.9 |
| Not poor | 28,796 | 2,157 | 7.5 | 217 | 0.8 |
| Income not reported | 4,829 | 404 | 8.4 | 41 | 0.9 |
| Age of oldest child | |||||
| Less than age 3 | 4,246 | 243 | 5.7 | 15 | 0.4 |
| Age 3 – 5 | 4,930 | 473 | 9.6 | 21 | 0.4 |
| Age 6 – 11 | 11,567 | 1,261 | 10.9 | 123 | 1.1 |
| Age 12 – 17 | 18,818 | 2,301 | 12.2 | 331 | 1.8 |
| Number of children | |||||
| One child | 16,674 | 1,497 | 9.0 | 171 | 1.0 |
| Two children | 14,404 | 1,468 | 10.2 | 140 | 1.0 |
| Three or more children | 8,482 | 1,312 | 15.5 | 179 | 2.1 |
| Race/ethnicity | |||||
| White, non-Hispanic | 24,186 | 1,720 | 7.1 | 146 | 0.6 |
| Black, non-Hispanic | 5,593 | 1,024 | 18.3 | 146 | 2.6 |
| Other, non-Hispanic | 2,541 | 234 | 9.2 | 26 | 1.0 |
| Hispanic origin | 7,241 | 1,300 | 18.0 | 171 | 2.4 |
| Educational attainment | |||||
| No one completed high school | 2,773 | 714 | 25.8 | 84 | 3.0 |
| Completed high school, no more | 9,062 | 1,482 | 16.4 | 190 | 2.1 |
| Some college, no degree | 12,679 | 1,527 | 12.0 | 178 | 1.4 |
| Bachelor’s degree or higher | 15,046 | 554 | 3.7 | 38 | 0.3 |
| Employment status | |||||
| At least one person employed full time | 33,169 | 2,739 | 8.3 | 281 | 0.9 |
| At least one person employed part time, no full-time | 2,551 | 437 | 17.2 | 62 | 2.4 |
| No one in the household in employed | 3,841 | 1,101 | 28.7 | 147 | 3.8 |
| Nativity | |||||
| At least one household member is foreign born | 8,938 | 1,180 | 13.2 | 164 | 1.8 |
| All household members are native born | 30,623 | 3,098 | 10.1 | 325 | 1.1 |
| Family structure | |||||
| Two-parent household | 26,661 | 1,927 | 7.2 | 202 | 0.8 |
| Single-parent household | 11,229 | 2,099 | 18.7 | 257 | 2.3 |
| No parents in the household | 1,672 | 253 | 15.1 | 30 | 1.8 |
| Region | |||||
| Northeast | 7,102 | 694 | 9.8 | 79 | 1.1 |
| Midwest | 8,754 | 816 | 9.3 | 78 | 0.9 |
| South | 14,332 | 1,725 | 12.0 | 172 | 1.2 |
| West | 9,373 | 1,042 | 11.1 | 161 | 1.7 |
Endnotes
This report is part of the National Center for Children in Poverty’s Who Are America’s Poor Children series. Estimates, unless otherwise noted, were prepared by Vanessa R. Wight and are based on the U.S. Current Population Survey, Food Security Supplement, December 2008. The food security supplement measures food security status at the household level. The estimates presented in this report are of households with children who completed the food security supplement and are restricted to households in which children live with at least one parent and most households with children living apart from both parents (for example, children being raised by grandparents). Households in which children live independently or live with a spouse are excluded from this analysis.
Race/ethnicity in this report is based on the status of the household head. For each household member in the CPS, race could be reported as one or more of the following: “White,” “Black,” “American Indian or Alaskan Native,” or “Asian and/or Hawaiian/Pacific Islander.” Hispanic origin was asked in a separate question. In the data reported, household heads who indicated their race as white, black, American Indian or Alaskan Native, or Asian and/or Hawaiian/Pacific Islander and their ethnicity as non-Hispanic are assigned their respective race. Household heads who reported to be of more than one race were assigned as Other. Those who identified themselves as Hispanic were categorized as Hispanic, regardless of their reported race. Educational attainment of the household adults is the education level of the most highly educated adult living in the household. Households are classified as either no one in the household completed a high-school degree; the most highly educated adult has a high school diploma, but no more; the most highly educated adult has some college, but no degree; the most highly educated adult has a bachelor’s degree or more. The employment status of household adults is the employment level of the adult in the household with the highest level of employment. Level of employment is based on responses to how many hours respondents usually worked at their main and other job. Households are classified as either having no employed adults; having at least one adult employed part time (less than 35 hours per week), but no adults employed full time; or having at least one adult in the household employed full time (35 or more hours per week). Appropriate weights were applied to obtain nationally representative estimates of food insecurity in the United States.
This research was supported by funding from the Annie E. Casey Foundation and an anonymous donor. The author would like to thank Mark Nord at the Food Assistance Branch of the Economic Research Service, U.S. Department of Agriculture for his thoughtful comments and programming support during the development of this report. Special thanks also to Yumiko Aratani, Janice Cooper, Curtis Skinner, Morris Ardoin, Amy Palmisano, and Telly Valdellon.
1. Nord, Mark; Andrews, Margaret; Carlson, Steven. 2009. Household Food Security in the United States, 2008 (Economic Research Report No. 83). Washington, DC: U.S. Department of Agriculture.
3. Nord, Mark. 2009. Food Insecurity in Households with Children: Prevalence, Severity, and Household Characteristics. (Economic Information Bulletin 56). Economic Research Service: U.S. Department of Agriculture.
5. Nord, Mark; Andrews, Margaret; Carlson, Steven. 2009. Household Food Security in the United States, 2008 (Economic Research Report No. 83). Washington, DC: U.S. Department of Agriculture.
6. Information on income is limited in the Food Security Supplement and only available in categories. Therefore, poverty status of households is calculated by comparing the midpoint of the household’s reported income to the Census Bureau’s 2008 Poverty Thresholds. Households with income that falls below the poverty threshold, given number of adults, number of children, and whether the reference person is elderly (aged 65 and older), are considered poor.
7. All estimates of food insecurity include households with very low food security among children.
8. Wight, Vanessa R.; Chau, Michelle. 2009. Basic Facts About Low-income Children, Children Under Age 18, 2008. New York, NY: National Center for Children in Poverty, Columbia University, Mailman School of Public Health.