Learn about our Improving the Odds for Adolescents project.
Vulnerable Teens
Overall rates of injury and death increase dramatically from childhood to late adolescence. Due to developmental and social factors, such as time spent without adult supervision and increasing independence, adolescents are more likely to engage in risk-taking behaviors than either younger children or adults. Biology also plays a role. The maturation of brain networks responsible for self-regulation often does not occur until late adolescence, making adolescents more likely to engage in risk-taking behaviors. These are just a few of the factors that contribute to greater risk of injury or violence in this age group.
Violence and unintentional injury are two of the interrelated areas of vulnerability that adolescents may encounter. Combined with problems related to mental health, sexual and reproductive health, substance use, and nutrition and obesity, violence and unintentional injury form part of a complex web of potential challenges to adolescents’ health.
Facts about Violence and Unintentional Injury
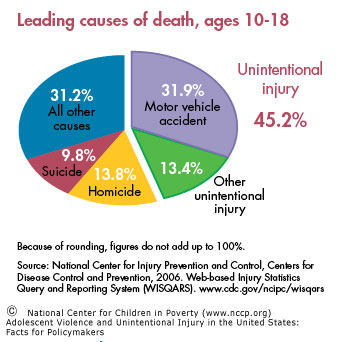
Alcohol use by adolescents increases risk of both violence and unintentional injury. The latter is the leading cause of death among all adolescents, and motor vehicle crashes account for the majority of these injuries.
Motor Vehicle Accidents and Unintentional Injuries
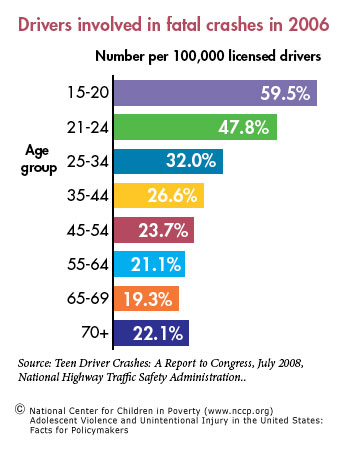
Adolescents and young adults (age 15-20) have the highest rates of fatal motor vehicle crash involvement (59.5/100,000). The risk is higher for adolescent males.
Age
- Per mile driven, drivers age 16 to 19 are four times more likely to crash than older drivers.
Gender
- In 2005, the motor vehicle death rate for male drivers and passengers age 16 to 19 was more than one and a half times that of their female counterparts.
Race
- African-American students (12%) and Hispanic students (13%) were more likely than white students (10%) and males (14%) were more likely than females (9%) to rarely or never wear seat belts.
Behavior
- Nearly 50 percent of adolescents admit to text messaging while driving, which recent studies found increases risk of crash by up to 23 times and may cause as much or more impairment than drinking.
Violence
Substantial numbers of serious violent offenders emerge in adolescence without warning signs in childhood and the cost of youth violence exceeds $158 billion each year.
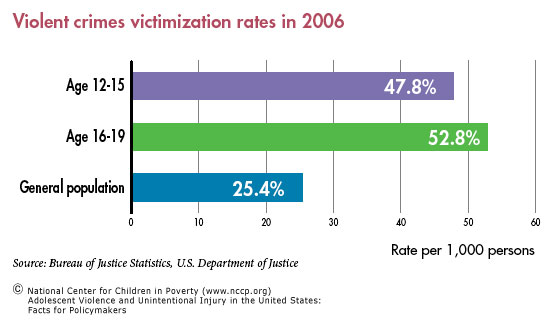
Adolescents are victimized by violent crimes at a higher rate than any other age group (47/1,000 for age 12-15 and 52/1,000 for age 16-19, as compared to 25.4/1,000 for the general population). The effects of violence may compound or interact with other risks already faced by adolescents.
In 2006, more than 720,000 young people (age 10 to 24) were treated in emergency departments for injuries sustained from violence.
- Studies vary: between nine and 60 percent of adolescents have experienced some form of dating violence.
- Victims of dating violence are not only at increased risk for injury, they are also more likely to engage in sexual activity (2.6 times), binge drinking (1.3 times), suicide attempts (3.3 times), and physical fights (1.7 times).
- Among 10 to 19 year-olds, homicide is the leading cause of death for African Americans but not for their Hispanic or White counterparts.
- Forty-four percent of lesbian, gay, bisexual, or transgender students reported being physically harassed.
System-level Challenges in Preventing and Treating Violence and Unintentional Injury
Access and Utilization
Adolescents’ access and use of health and health-related services lag behind that of other children.
- Adolescents are more likely to be uninsured than any other age group and represented 40 percent of the eight million uninsured children in 2008.
- Of the 195 accredited pediatric residency training programs in the U.S., 27 have fellowship programs in adolescent medicine.
- In a survey of over 350 hospitals emergency departments (ED), about 50 percent admit pediatric patients but do not have a specialized inpatient pediatric ward. Twenty-five percent have access to an ED pediatric attending physician at all times, and only six percent have all recommended pediatric supplies.
- Despite evidence that preventive counseling from a clinician improves seat belt and helmet use and decreases use of illegal substances and other high-risk behaviors among adolescents, few clinicians provide such counseling.
Curricula and After-school Programs
- Sixty-five percent of states required teaching of violence prevention in middle and high schools, and there is little information available on whether or how often evidence-based curricula are used.
- From 2000 to 2006, where violence prevention was taught in high schools, the median number of hours of instruction required decreased from 4.1 to 2.5.
- Two states, Illinois and New York, have passed legislation requiring schools to address social and emotional learning, a critical element of effective violence prevention programs.
- Eight percent of children enrolled in after-school programs are high of school age.
Licensing Regulation
- The Insurance Institute for Highway Safety survey rated driver licensing systems as only “fair” or “marginal” in more than 20 states. Higher ratings are dependent on implementing safety precautions such as graduated driver licensing, which reduces crash risk for teen drivers.
Recommendations
Most highly effective programs combine components that address both individual risks and environmental conditions. They often do this by targeting individual skills and competencies, as well as by using interventions appropriate to the emotional and cognitive capacities of adolescents. A comprehensive health prevention and response system that fosters communication and cooperation across sectors can provide adolescents better access to high quality services and supports that are responsive to their unique needs. Specifically, federal and state governments should:
- fund programs that foster improved decision-making skills and provide positive models to reduce risk-taking behaviors that often lead to violence and injury. High quality after school programs that target at-risk youth reduce crime, criminal victimization, alcohol and substance use, teen pregnancy, and risky behaviors.
- support programs that educate and empower young people as peer educators and advocates. Peers influence youth’s health behaviors. Research shows that people are more likely to change behaviors and attitudes if they can identify with the messenger.
- provide funding to replicate school-based health centers throughout the state, particularly those that provide mental health, behavioral health, and counseling services. Access to on-site, school-based health centers increases the likelihood that adolescents will receive health and counseling services.
- pass legislation to support empirically proven strategies to reduce risky and dangerous behaviors among adolescents, such as:
- — enforcement of primary seat belt laws and passenger laws;— implementation of graduated driver licensing programs;— universal implementation of proven violence prevention programs;
— regulation of the sale and resale of firearms; and
— enforcement of underage drinking laws.Young people age 15 to 24 represent only 14 percent of the U.S. population but account for 30 percent ($19 billion) of the total costs of motor vehicle injuries among males and 28 percent ($7 billion) of total costs among females.
- finance effective, evidence-based programs to help parents recognize behavioral problems in their children and prevent negative behaviors, such as Functional Family Therapy or other Blueprints model programs. Parenting style can contribute to aggressive behavior or moderate negative influences.
- finance mechanisms to allow foster youth to voluntarily retain state guardianship with appropriate services and supports up to age 25. Former foster youth more often become involved in crime or are victims of crime, and they more frequently experience episodes of homelessness.
- provide incentives to hospital emergency departments to provide high quality treatment and rehabilitation services for pediatric patients. Because children’s and adolescents’ bodies respond differently than adults’ in similar medical crises, they require care that responds to their unique needs and equipment that has been specifically designed for their size.
This fact sheet is supported by a generous grant from The Atlantic Philanthropies.
Endnotes
The author thanks Leslie L. Davidson for her guidance in developing this fact sheet.
1. Fishbein, D. 2006. Adolescent Brain Development lecture. Federal Advisory Committee on Juvenile Justice website. Accessed June 2009, from www.facjj.org/docs/adolesbraindfishbein_5_09_06_reduced.ppt.
2. Steinberg, L.; Dahl, R.; Keating, D.; Kupfer, D. J.; Masten, A. S.; Pine, D. S. 2006. The Study of Developmental Psychopathology in Adolescence: Integrating Affective Neuroscience with the Study of Context. Handbook of Developmental Psychopathology. D. Cicchetti, (ed.). John Wiley & Sons, New York.
3. Beatty, A.; Chalk, R. 2007. A Study of Interactions: Emerging Issues in the Science of Adolescence. Program Committee for a Workshop on the Synthesis of Research on Adolescent Health and Development, Board on Children, Youth, and Families, Division of Behavioral and Social Sciences and Education. National Research Council and Institute of Medicine. Washington, DC: The National Academies Press. p. 8.
4. Miller, Jacqueline W.; Nain, Timothy S.; Brewer, Robert D.; Jones, Sherry E. 2007. Binge Drinking and Associated Health Risk Behaviors Among High School Students. Pediatrics 119:76-85.
5. Mortality Reports Database, Web-based Injury Statistics Query and Reporting System (WISQARS), National Center for Injury Prevention and Control, Centers for Disease Control and Prevention. 2009. Accessed June 2009, from www.cdc.gov/ncipc/wisqars.
6. Teen Driver Crashes, A Report to Congress, July 2008. National Highway Traffic Safety Administration www. nhtsa.gov/staticfiles/DOT/NHTSA/Traffic%20Injury%20 Control/Articles/Associated%20Files/811005.pdf. Accessed March 2009.
7. Injury and Violence Prevention, June 2009, National Conference of State Legislatures. 2009. National Conference of State Legislatures website. Accessed July 2009, from www.ncsl.org/programs/health/injuryprevention.htm.
8. Web-based Injury Statistics Query and Reporting System (WISQARS), National Center for Injury Prevention and Control, Centers for Disease Control and Prevention. 2008. www.cdc.gov/ncipc/wisqars. Accessed June 2009, from www.cdc.gov/MotorVehicleSafety/Teen_Drivers/teendrivers_factsheet.html.
9. Centers for Disease Control and Prevention, Youth Online Comprehensive Results.Youth Risk Behavior Surveillance – United States 2007. apps.nccd.cdc.gov/yrbss/CategoryQuestions.asp?cat=1&desc=Unintentional%20Injuries%20and%20Violence. Accessed July 2009.
10. New Data from VTTI Provides Insight into Cell Phone Use and Driving Distraction. 2009. Virginia Tech Transportation Institute. www.vtti.vt.edu/PDF/7-22-09- VTTI-Press_Release_Cell_phones_and_Driver_Distraction.pdf. Accessed Aug. 2009.
11. AAA Colorado Teen Driver Survey – Key Findings. 2007. AAA Colorado. www.encompassmag.com/tds_2007/tds_key_findings.html. Accessed Oct. 2009.
12. Youth Violence: A Report of the Surgeon General. 2001. Office of the Surgeon General. U.S. Department of Health and Human Services. www.surgeongeneral.gov/library/youthviolence/. Accessed July 2009.
13. State Costs of Violence Perpetrated by Youth. 2000. Children’s Safety Network Economics & Data Analysis Resource Center. Accessed Dec. 2008.
14. U.S. Department of Justice, Office of Justice Programs, Bureau of Justice Statistics. 2006. Criminal Victimization in the United States: Victimization Rates for Persons Age 12 and Over, By Type of Crime and Age of Victims. www.ojp.usdoj.gov/bjs/pub/pdf/cvus/current/cv0603.pdf. Accessed July 2009.
15. U.S. Department of Justice, Office of Justice Programs, Bureau of Justice Statistics. 2006. Criminal Victimization in the United States: Number, Percent Distribution, and Rate of Victimizations, By Type of Crime. www.ojp.usdoj.gov/bjs/pub/pdf/cvus/current/cv0601.pdf. Accessed Aug. 2009.
17. Halpern, C.T.; Oslack, S.G.; Young, M.L.; Waller, M.W.; Martin, S.L.; Kupper, L.L. 2001. Partner Violence Among Adolescents in Opposite-sex Romantic Relationships: Findings From the National Longitudinal Study of Adolescent Health. American Journal of Public Health. 91:1679-1685.
18. Centers for Disease Control and Prevention, MMWR, 55:19, May 19, 2006.
19. Web-based Injury Statistics Query and Reporting System (WISQARS), National Center for Injury Prevention and Control, Centers for Disease Control and Prevention. 2008. www.cdc.gov/ncipc/wisqars. Accessed March 2009 via www.cdc.gov/ncipc/dvp/YV_DataSheet.pdf.
20. Kosciuw, Joseph G.; Diaz, Elizabeth M.; Greytak, Emily A. 2007. The 2007 National School Climate Survey. Gay, Lesbian and Straight Education Network. www.glsen.org/binary-data/GLSEN_ATTACHMENTS/file/000/001/1290-1.pdf. Accessed Sept. 29, 2009.
21. Yu, S. M.; Bellamy, H. A.; Kogan, M. D.; Dunbar, J. L.; Schwalberg, R. H.; Schuster, M. A. 2002. Factors that Influence Receipt of Recommended Preventive Pediatric Health and Dental care. Pediatrics, 110(6): e73.
22. Center for Financing, Access, and Cost Trends. 2005. Total Population and Uninsured Persons Under Age 65: Percent by Selected Population Characteristics, United States, First Half of 2005 (Table 1). Accessed Dec. 11, 2006.
23. American Academy of Pediatrics, Department of Practice. Children’s health insurance status and Medicaid/ SCHIP eligibility and enrollment. www.aap.org/research/cps.pdf. Accessed Oct. 2009.
24. Number of Accredited Programs for the Current Academic Year (2009-2010), Accreditation Council for Graduate Medical Education. Accreditation Council for Graduate Medical Education website. Accessed July 2009, from www.acgme.org/adspublic/.
25. Training Opportunities in Adolescent Medicine – 2010, The Society for Adolescent Medicine. The Society for Adolescent Medicine website. Accessed July 2009.
26. Middleton, K. R.; Burt, C. W. 2006. Availability of Pediatric Services and Equipment in Emergency Departments: United States, 2002-03. Advance Data367: 1-6.
27. Napier, M. 2006. Health Behavior Assessments Lacking in Primary Care Settings. Robert Wood Johnson Foundation Research Highlight No. 9. www.rwjf.org/files/publications/other/Research_Highlight_9_0609.pdf. Accessed Aug. 2009.
28. Johnston, B. D.; Rivara, F. P.; Droesch, R. M., Dunn, C.; Copass, Michael K. 2002. Behavior Change Counseling in the Emergency Department to Reduce Injury Risk: A Randomized, Controlled Trial. Pediatrics 110: 267–274.
29. Ozer, E.; Adams, S.; Lustig, J.; Millstein, S.; Wibbelsman, C.; Elster, Arthur; Irwin, Charles. 2003. Do Clinical Preventive Services Make a Difference in Adolescent Behavior? Journal of Adolescent Health 32: 132.
30. Ozer, E. The Adolescent Primary Care Visit: Time to Build on Strengths. 2007. Journal of Adolescent Health (41)6: 519-520.
31. School Health Policies and Programs Study 2006. 2007. Journal of School Health 77(8) www.cdc.gov/healthyyouth/shpps/2006/factsheets/pdf/FS_ViolencePrevention_SHPPS2006.pdf. Accessed June 2009.
33. Standards and Policy, Collaborative for Academic, Social, and Emotional Learning. Collaborative for Academic, Social, and Emotional Learning website. Accessed March 2009, from www.casel.org/standards/policy.php.
34. Dusenbury, L.; Falco, M.; Lake, A.; Brannigan, R.; Bosworth, K. 1997. Nine Critical Elements of Promising Violence Prevention Programs. Journal of School Health 67: 409-414.
35. Afterschool Alliance. 2006. Older Youth Need Afterschool Programs. Accessed Aug. 2009.
36. Insurance Institute for Highway Safety. 2008. US Licensing Systems for Young Drivers. www.iihs.org/laws/graduatedLicenseIntro.aspx. Accessed March 2009.
37. Shope, J. T.; Molnar, L. J. 2003. Graduated Driver Licensing in the United States: Evaluation Results from the Early Programs. Journal of Safety Research 34: 63–9.
38. Simpson, H. M. 2003. The Evolution and Effectiveness of Graduated Licensing. Journal of Safety Research 34: 25–34.
40. Understanding Youth Violence. National Mental Health Information Center: Center for Mental Health Services, Substance Abuse and Mental Health Services Administration, U.S. Department of Health and Human Services. Accessed July 2009, from mentalhealth.samhsa.gov/schoolviolence/youth.asp.
41. Hall, Georgia; Gruber, Diane. 2007. Back to the Future: Engaging Older Youth. The Massachusetts Special Commission on After School and Out of School Time Issue Brief.
42. Sloane B. C.; Zimmer C. G. 1993. The Power of Peer Health Education. Journal of American College Health 41: 241-245.
43. Juszczak, Linda; Melinkovich, P.; Kaplan, D. 2003. Use of Health and Mental Health Services by Adolescents Across Multiple Delivery Sites. Journal of Adolescent Health 32S: 108-118.
44. Kaplan, D. W.; Calonge, B. N.; Guernsey, B. P.; Hanrahan, M. B. 1998. Managed Care and SBHCs: Use of Health Services. Archives of Pediatric and Adolescent Medicine 152(1): 25-33.
45. Driving Through The Eyes of Teens. The Center for Injury Research and Prevention at the Children’s Hospital of Philadelphia. 2007. stokes.chop.edu/programs/injury/files/PCPS_Reports/1289teen.pdf. Accessed Sept. 2007.
46. Chen, L. H.; Baker, S. P.; Li, G. 2005. Graduated License Programs and Fatal Crashes of 16-year-old Drivers: A National Evaluation. Pediatrics 118: 56-62.
47. Ferguson, S. A.; Toeh, E. R.; McCartt, A. T. 2007. Progress in Teenage Crash Risk During the Last Decade. Journal of Safety Research 38: 137-145.
48. Vernick, J. S.; Webster, D. W.; Bulzacchelli, M. T.; Mair, J. S. 2006. Regulation of Firearm Dealers in the United States: An Analysis of State Law and Opportunities for Improvement. Journal of Law, Medicine and Ethics 34(4): 765-775.
49. Fell, James C.; Fisher, Deborah A.; Voas, Robert B.; Blackman, Kenneth; Tibbetts, A.S. 2009. Alcoholism: Clinical and Experimental Research33(7):1208-19.
50. Finkelstein, E. A.; Corso, P. S.; Miller, T. R. 2006. Incidence and Economic Burden of Injuries in the United States. New York: Oxford University Press.
51. Blueprints for Violence Prevention. Center for the Study of Violence. University of Colorado. www.colorado.edu/cspv/blueprints/. Accessed Aug. 2009.
52. Patten, P.; Robertson, A. S. 2001. Violence Prevention Resource Guide for Parents. Clearinghouse on Early Education and Prevention website. ceep.crc.uiuc.edu/pubs/ivpaguide.html. Accessed Aug. 2009.
53. Courtney, M. 2005. Network on Transitions to Adulthood Policy Brief. MacArthur Foundation Research Network on Transitions to Adulthood and Public Policy. Accessed July 2009, from www.transad.pop.upenn.edu/downloads/courtney–foster%20care.pdf.
54. Krug, Steven. 2006. Emergency Care Crisis: A Nation Unprepared for Public Health Disasters. Testimony before Homeland Security Subcommittee on Emergency Preparedness, Science and Technology. American Academy of Pediatrics website. www.aap.org/sections/pem/er_readiness_testimonyfinal.pdf. Accessed Aug. 2009.