To find comparable information for all children, see Basic Facts about Low-Income Children: Children under 18 Years, 2015; for infants and toddlers, see Basic Facts about Low–Income Children: Children under 3 Years, 2015; for young children, see Basic Facts about Low-Income Children: Children under 6 Years, 2015; for children in middle childhood, see Basic Facts about Low-Income Children: Children 6 through 11 Years, 2015.
Among all children under 18 years in the U.S., 43 percent live in low-income families and 21 percent—approximately one in five—lives in a poor family. This means that children are overrepresented among our nation’s poor; they represent 23 percent of the population but comprise 33 percent of all people in poverty. Many more children live in families with incomes just above the poverty threshold.
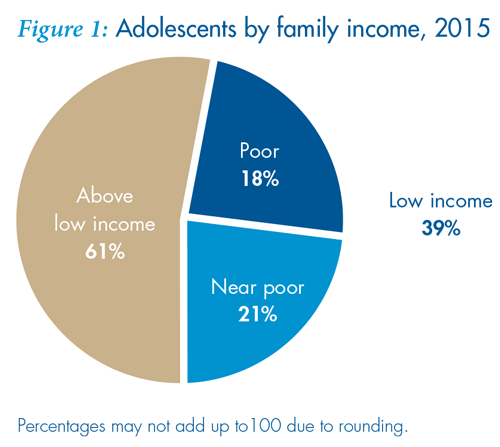
Among our oldest children, adolescents ages 12 through 17 years, 39 percent live in low-income families and 18 percent live in poor families. Being a child in a low-income or poor family does not happen by chance. Parental education and employment, race/ethnicity, and other factors are associated with children’s experience of economic insecurity. This fact sheet describes the demographic, socioeconomic, and geographic characteristics of adolescents and their parents. It highlights the important factors that appear to distinguish low-income and poor children in this age group from their less disadvantaged counterparts.
How many adolescents, ages 12 through 17 years, live in low-income families in the United States?
There are more than 24 million adolescents ages 12 through 17 years in the United States.
- 39 percent—9.4 million—live in low-income families
- 18 percent—4.3 million—live in poor families
Note: Above low income is defined as at or above 200% of the federal poverty threshold (FPT), poor is defined as below 100% of FPT, and near poor is between 100% and 199% of the FPT. The low-income category includes both the poor and the near poor.
What is the 2015 federal poverty threshold (FPT)?
- $24,036 for a family of four with two children
- $19,078 for a family of three with one child
- $16,337 for a family of two with one child
Is a poverty-level income enough to support a family?
Research suggests that, on average, families need an income equal to about two times the federal poverty threshold to meet their most basic needs. Families with incomes below this level are referred to as low income:
- $48,072 for a family of four with two children
- $38,156 for a family of three with one child
- $32,674 for a family of two with one child
These dollar amounts approximate the average minimum income families need to make ends meet, but actual expenses vary greatly by locality. In 2014, the cost of meeting basic needs for a family of four required about $85,800 per year in Boston, Massachusetts; $61,500 in Akron, Ohio; $57,200 in Tulsa, Oklahoma; and $53,600 in McAllen, Texas.
Has the percentage of adolescents living in low-income and poor families changed over time?
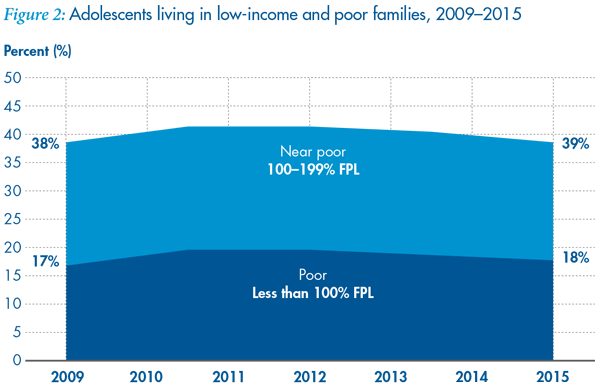
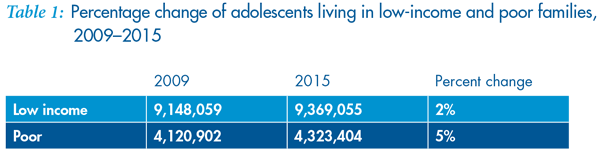
The percentage of adolescent children living in low-income families (both poor and near poor) increased from 38 percent in 2009 to 39 percent in 2015, although this figure decreased from a high of 41 percent in 2012. (Figure 2). Between 2009 and 2015, the overall number of adolescent children ages 12 through 17 years remained relatively constant, while the numbers of these children who were low income and poor increased by 2 percent and 5 percent, respectively (Table 1).
How do adolescents compare to the rest of the population?
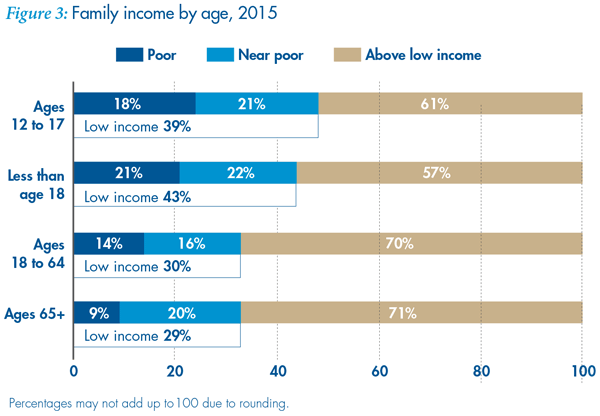
The percentage of adolescents in low-income families surpasses that of adults. In addition, adolescents ages 12 through 17 years are twice as likely as adults 65 years and older to live in poor families (Figure 3).
Does the percentage of children in low-income families vary by age group?
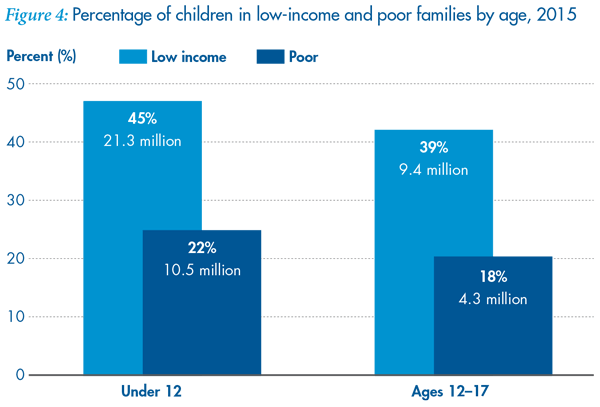
The percentages of children who live in low-income and poor families vary by age group. Adolescents are less likely to live in low-income families than younger children (Figure 4).
- 39 percent of children ages 12 through 17 years—9.4 million—live in low-income families
- 18 percent of children ages 12 through 17 years—4.3 million—live in poor families
- 45 percent of children under age 12 years—21.3 million— live in low-income families
- 22 percent of children under age 12 years—10.5 million— live in poor families
Does the percentage of adolescents in low-income families vary by race/ethnicity?
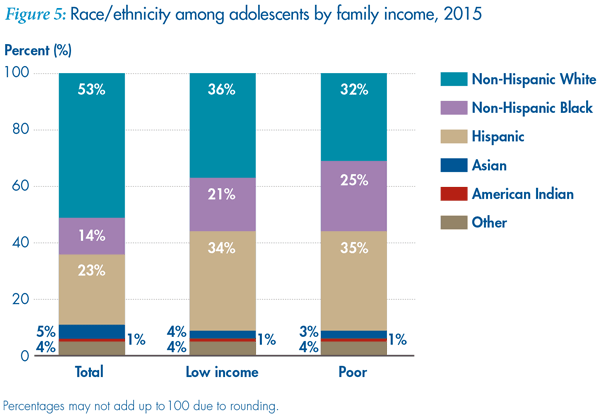
As Figure 5 illustrates, the percent- ages of low-income and poor ado- lescents vary by race and ethnicity: whites comprise the largest share of all adolescents living in low-income families (36 percent) while Hispanics make up the largest share of poor children in this age group (35 percent).
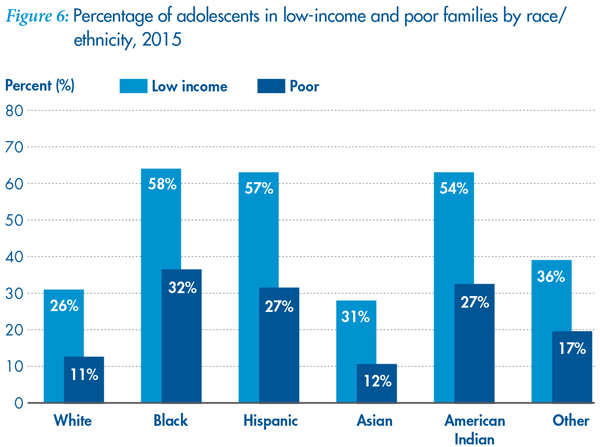
Black, American Indian, and Hispanic children are disproportionately low income and poor (Figure 6).
- 58 percent of black adolescents—1.9 million—live in low-income families
- 57 percent of Hispanic adolescents—3.2 million— live in low-income families
- 54 percent of American Indian adolescents—0.1 million—live in low-income families
- 31 percent of Asian adolescents—0.4 million— live in low-income families
- 26 percent of white adolescents—3.4 million— live in low-income families
- 36 percent of adolescents of some other race—0.4 million—live in low-income families
Does the percentage of adolescents in low-income families vary by parents’ nativity?
- 51 percent of adolescents with immigrant parents—3.0 million—live in low-income families
- 35 percent of adolescents with native-born parents—6.3 million—live in low-income families
What are the family characteristics of low-income and poor adolescents?
Parents’ Employment
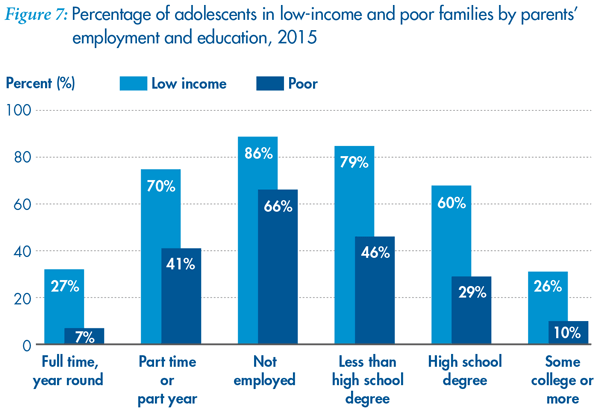
Adolescents with a full-time, year-round employed parent are less likely to live in a low-income family, compared to adolescents with parents who work part time/part year or who are not employed (Figure 7).
- 27 percent of adolescents with at least one parent who works full time, year round—5.0 million—live in low-income families
- 7 percent of adolescents with at least one parent who works full time, year round—1.4 million—live in poor families
- 70 percent of adolescents with no parent who works full time, but at least one parent who works part time or part year—2.6 million— live in low-income families
- 41 percent of adolescents with no parent who works full time, but at least one parent who works part time or part year—1.6 million— live in poor families
- 86 percent of adolescents with no employed parents—1.8 million—live in low-income families
- 66 percent of adolescents with no employed parents—1.4 million—live in poor families
Nevertheless, many low-income and poor adolescents have parents who work full time. Over half of low-income and 32 percent of poor children in this age group live with at least one parent employed full time, year round.
Parents’ Education
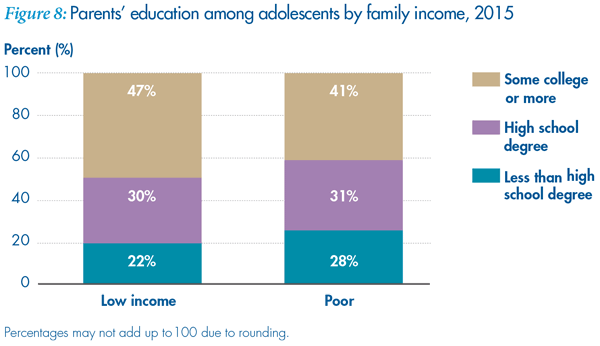
Higher levels of parental education decrease the likelihood that a child will live in a low-income or poor family. Among adolescents with at least one parent with some college or additional education, 26 percent live in low-income and 10 percent in poor families. By contrast, among adolescents whose parents have less than a high school degree, 79 percent live in low-income and 46 percent in poor families (Figure 7).
- 79 percent of adolescents with parents who have less than a high school degree—2.1 million—live in low-income families
- 60 percent of adolescents with parents who have a high school degree but no college—2.8 million—live in low-income families
- 26 percent of adolescents with at least one parent who has some college oradditional education—4.4 million—live in low-income families
At the same time, significant shares of low-income and poor families with adolescent children are headed by parents with at least some college education, as shown in Figure 8.
Family Structure
Forty-six percent of adolescents in low-income families—4.3 million—and 36 percent of adolescents in poor families – 1.5 million – live with married parents. Children who live with married parents are much less likely to be poor or low income compared to children who live with a single parent.
- 27 percent of adolescents residing with married parents—4.3 million—live in low-income families
- 9 percent of adolescents residing with married parents—1.5 million—live in poor families
- 62 percent of adolescents residing with a single parent—5.0 million—live in low-income families
- 34 percent of adolescents residing with a single parent—2.8 million—live in poor families
Does the percentage of adolescents in low-income families vary by where they live?
Region
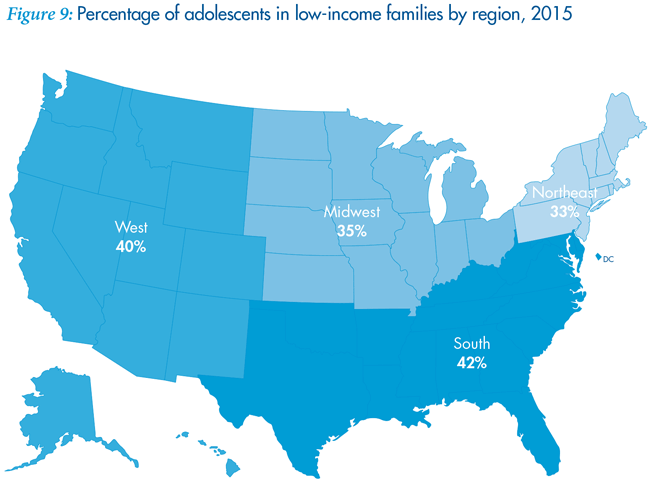
The percentage of adolescents in low-income families varies substantially by region (Figure 9).
- 42 percent of adolescents in the South—3.9 million—live in low-income families
- 40 percent of adolescents in the West—2.3 million—live in low-income families
- 35 percent of adolescents in the Midwest—1.9 million— live in low-income families
- 33 percent of adolescents in the Northeast—1.3 million— live in low-income families
Residential Instability and Home Ownership
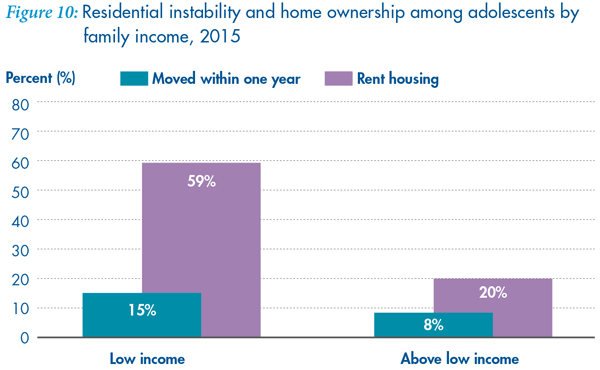
Research suggests that stable housing is important for healthy child development. However, adolescents living in low-income families are about two times as likely as other adolescents to have moved in the past year and about three times as likely to live in families that rent, rather than own, a home (Figure 10).
- 15 percent of adolescents in low-income families—1.4 million—moved in the last year
- 8 percent of adolescents in families with above the low-income threshold—1.2 million—moved in the last year
- 59 percent of adolescents in low-income families—5.5 million—live in families who rent their homes
- 20 percent of adolescents in families with above the low-income threshold—3.0 million—live in families who rent their homes
Are adolescents in low-income families covered by health insurance?
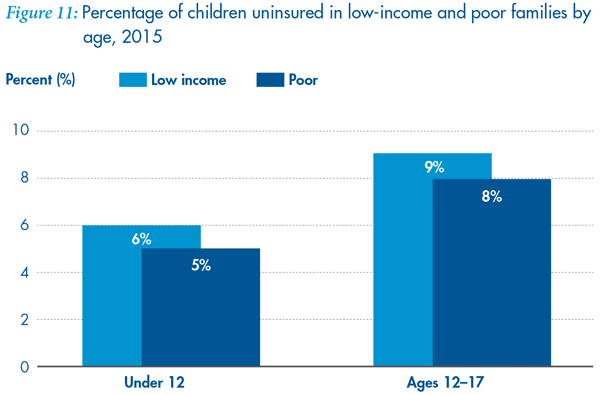
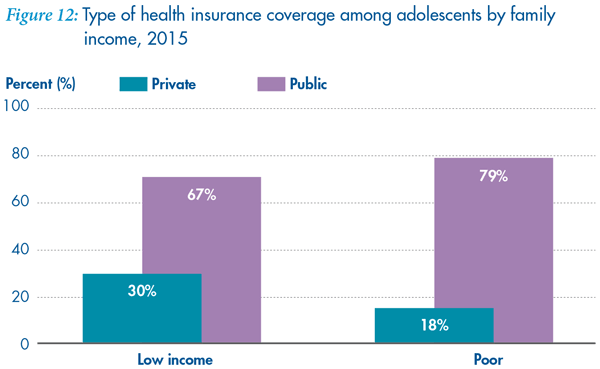
Consistent with research suggesting older children in general are particularly at risk of being uninsured, low-income and poor adolescents are more likely to be without health insurance coverage than their younger counterparts. Approximately 9 percent living in low-income families and 8 percent living in poor families report no insurance coverage of any kind (Figure 11). Public insurance reaches more than two-thirds (67 percent) of low-income and over three-fourths (79 percent) of poor adolescents, while private health insurance covers close to one-third (30 percent) of low-income and 18 percent of poor adolescents (Figure 12).
- 9 percent of adolescents living in low-income families—0.8 million—are uninsured
- 30 percent of adolescents living in low-income families—2.8 million—are covered by private insurance
- 67 percent of adolescents living in low-income families—6.3 million—are covered by public