To find comparable information for infants and toddlers, see Basic Facts about Low-Income Children: Children under 3 Years, 2015; for young children, see Basic Facts about Low–Income Children: Children under 6 Years, 2015; for children in middle childhood, see Basic Facts about Low-Income Children: Children 6 through 11 Years, 2015; for adolescent children, see Basic Facts about Low-Income Children: Children 12 through 17 Years, 2015.
Among all children under 18 years in the U.S., 43 percent live in low-income families and 21 percent—approximately one in five—lives in a poor family. This means that children are overrepresented among our nation’s poor; they represent 23 percent of the population but comprise 33 percent of all people in poverty. Many more children live in families with incomes just above the poverty threshold.
Being a child in a low-income or poor family does not happen by chance. Parental education and employment, race/ethnicity, and other factors are associated with children’s experience of economic insecurity. This fact sheet describes the demographic, socioeconomic, and geographic characteristics of children and their parents. It highlights the important factors that appear to distinguish low-income and poor children from their less disadvantaged counterparts.
How many children under age 18 years live in low-income families in the United States?
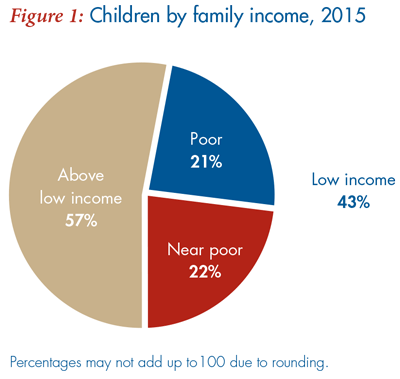
There are nearly 72 million children under age 18 years in the United States.
- 43 percent – 30.6 million – live in low-income families
- 21 percent – 14.8 million – live in poor families
Note: Above low income is defined as at or above 200% of the federal poverty threshold (FPT), poor is defined as below 100% of FPT, and near poor is between 100% and 199% of the FPT. The low-income category includes both the poor and the near poor.
What is the 2015 federal poverty threshold (FPT)?
- $24,036 for a family of four with two children
- $19,078 for a family of three with one child
- $16,337 for a family of two with one child
Is a poverty-level income enough to support a family?
Research suggests that, on average, families need an income equal to about two times the federal poverty threshold to meet their most basic needs. Families with incomes below this level are referred to as low income:
- $48,072 for a family of four with two children
- $38,156 for a family of three with one child
- $32,674 for a family of two with one child
These dollar amounts approximate the average minimum income families need to make ends meet, but actual expenses vary greatly by locality. In 2014, the cost of meeting basic needs for a family of four required about $85,800 per year in Boston, Massachusetts; $61,500 in Akron, Ohio; $57,200 in Tulsa, Oklahoma; and $53,600 in McAllen, Texas.
Has the percentage of children living in low-income and poor families changed over time?
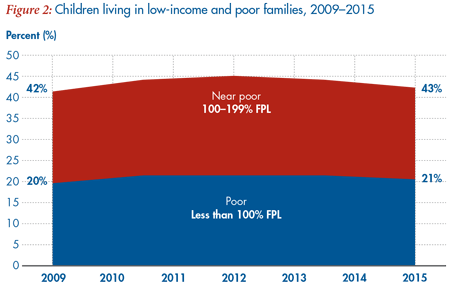
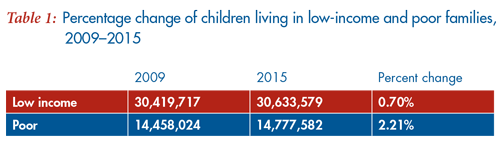
The percentage of children living in low-income families (both poor and near poor) increased from 42 percent in 2009 to 43 percent in 2015 (Figure 2), but has decreased from a high of 45 percent in 2012. Between 2009 and 2015, the overall number of children of all ages decreased by one percent, while the number of low-income children increased by 0.7 percent and the number of poor children increased by 2 percent (Table 1).
How do children compare to the rest of the population?
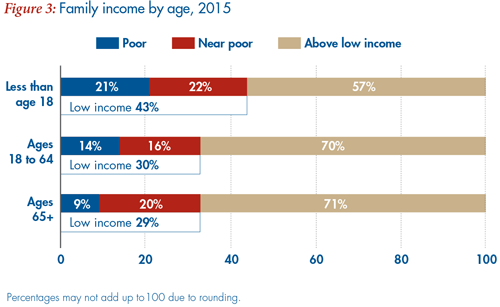
The percentage of all children under age 18 years in low-income families surpasses that of adults. In addition, children are more than twice as likely as adults 65 years and older to live in poor families (Figure 3).
Does the percentage of children in low-income families vary by age group?
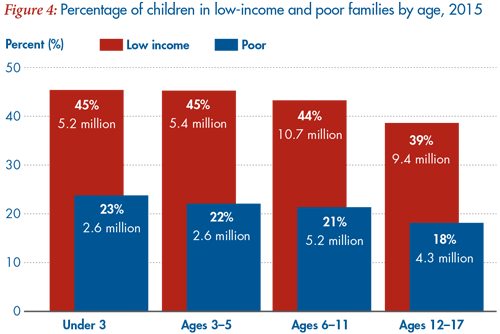
The percentages of children under 18 years who live in low-income and poor families are 43 percent and 21 percent, respectively, yet there is variation by age group. Younger children are more likely to live in low-income and poor families than older children (Figure 4).
- 45 percent of children under age 3 years—5.2 million— live in low-income families
- 45 percent of children ages 3 through 5 years—5.4 million—live in low-income families
- 44 percent of children ages 6 through 11 years—10.7 million—live in low-income families
- 39 percent of children ages 12 through 17 years—9.4 million—live in low-income families
Does the percentage of children in low-income families vary by race/ethnicity?
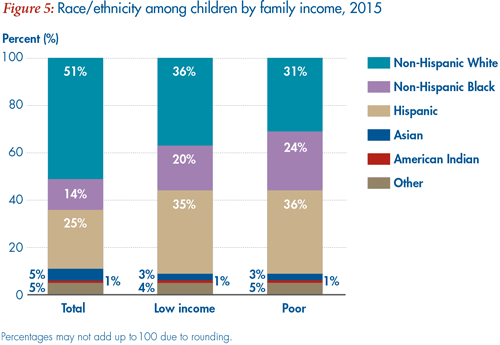
As Figure 5 illustrates, the percentages of low-income and poor children under 18 vary by race and ethnicity: whites comprise the largest share of all low-income children (36 percent, 11.0 million) while Hispanics make up the largest share of poor children (36 percent, 5.4 million).
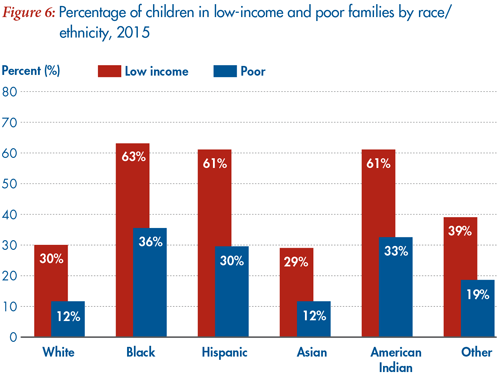
Black, American Indian, and Hispanic children are disproportionately low income and poor (Figure 6).
- 63 percent of black children—6.2 million—live in low-income families
- 61 percent of Hispanic children—10.8 million—live in low-income families
- 61 percent of American Indian children—0.3 million—live in low-income families
- 30 percent of white children—11.0 million—live in low-income families
- 29 percent of Asian children—1.0 million—live in low-income families
- 39 percent of children of some other race—1.4 million—live in low-income families
Does the percentage of children in low-income families vary by parents’ nativity?
- 52 percent of children with immigrant parents—9.5 million—live in low-income families
- 39 percent of children with native-born parents—21.2 million—live in low-income families
What are the family characteristics of low-income and poor children?
Parents’ Employment
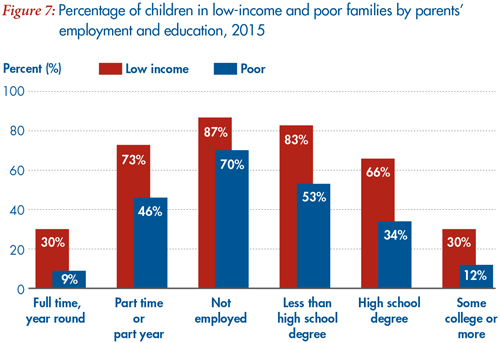
Children with a full-time, year-round employed parent are less likely to live in a low-income family, compared to children with parents who work part time/part year or who are not employed (Figure 7).
- 30 percent of children with at least one parent who works full time, year round—16.1 million—live in low-income families
- 9 percent of children with at least one parent who works full time, year round—4.6 million—live in poor families
- 73 percent of children with no parent who works full time, but at least one parent who works part time or part year—9.4 million—live in low-income families
- 46 percent of children with no parent who works full time, but at least one parent who works part time or part year—6.0 million—live in poor families
- 87 percent of children with no employed parents—5.9 million—live in low-income families
- 70 percent of children with no employed parents—4.8 million—live in poor families
Nevertheless, many low-income and poor children have parents who work full time. About half (53 percent) of low-income children and 31 percent of poor children live with at least one parent employed full time, year round.
Parents’ Education
Higher levels of parental education decrease the likelihood that a child will live in a low-income or poor family. Among children with at least one parent with some college or additional education, 30 percent live in low-income and 12 percent in poor families. By contrast, among children whose parents have less than a high school degree, 83 percent live in low-income and 53 percent in poor families (Figure 7).
- 83 percent of children with parents who have less than a high school degree—6.3 million—live in low-income families
- 66 percent of children with parents who have a high school degree but no college education—9.3 million—live in low-income families
- 30 percent of children with at least one parent who has some college or additional education—15.0 million— live in low-income families
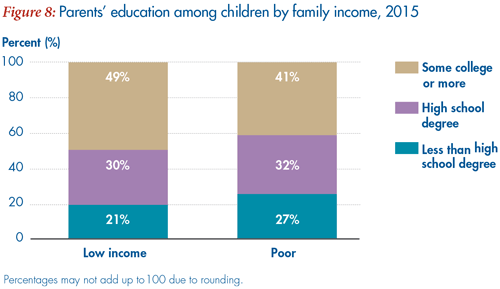
At the same time, significant shares of low-income and poor families with children are headed by parents with at least some college education, as shown in Figure 8.
Family Structure
About one-half of children (47 per- cent) in low-income families—14.3 million—and 35 percent of children in poor families—5.2 million—live with married parents. Children who live with married parents are much less likely to be poor or low income compared to children who live with a single parent.
- 30 percent of all children residing with married parents—14.3 million—live in low-income families
- 11 percent of all children residing with married parents—5.2 million—live in poor families
- 68 percent of all children residing with a single parent—16.3 million—live in low-income families
- 40 percent of all children residing with a single parent—9.5 million—live in poor families
Does the percentage of children in low-income families vary by where they live?
Region
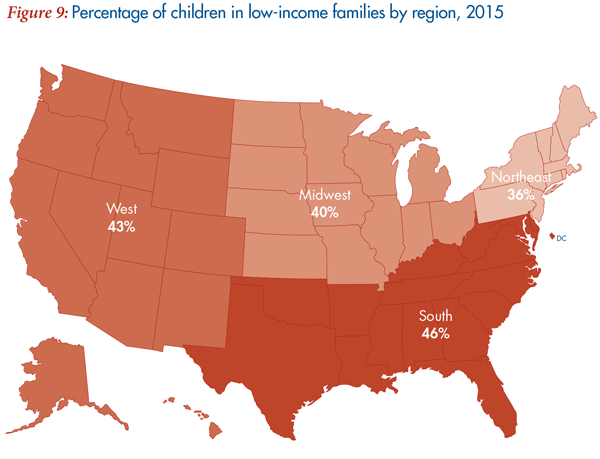
The percentage of children in low-income families varies substantially by region (Figure 9).
- 46 percent of children in the South—12.8 million—live in low-income families
- 43 percent of children in the West—7.5 million—live in low-income families
- 40 percent of children in the Midwest—6.1 million—live in low-income families
- 36 percent of children in the Northeast—4.2 million—live in low-income families
Residential Instability and Home Ownership
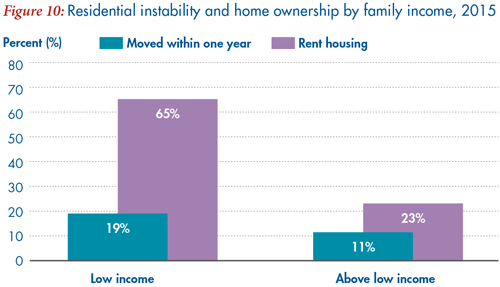
Research suggests that stable housing is important for healthy child development. However, children living in low-income families are nearly twice as likely as other children to have moved in the past year and nearly three times as likely to live in families that rent, rather than own, a home (Figure 10).
- 19 percent of children in low-income families—5.7 million—moved in the last year
- 11 percent of children in families above the low-income threshold—4.7 million— moved in the last year
- 65 percent of children in low-income families—19.9 million—live in families who rent their homes
- 23 percent of children in families above the low-income threshold—9.6 million—live in families who rent their homes
Are children in low-income families covered by health insurance?
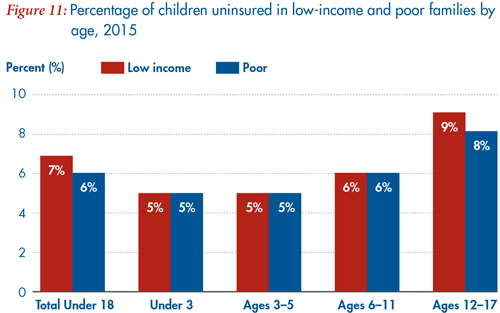
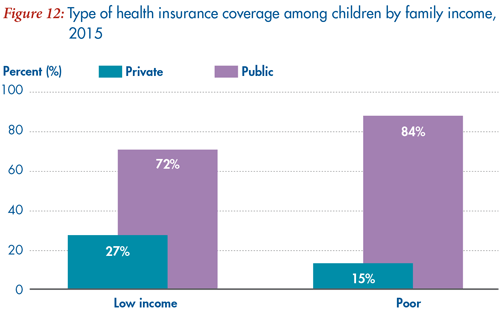
Among all children under age 18, approximately 7 percent living in low-income families and 6 percent living in poor families are uninsured. Consistent with research suggesting older children in general are particularly at risk of being uninsured, children ages 12 through 17 years in low-income and poor families are more likely to be uninsured compared to younger children in low-income and poor families (Figure 11). Public insurance reaches many more economically disadvantaged children than private plans, covering 72 percent of low-income children and 84 percent of poor children (Figure 12).
- 7 percent of children living in low-income families—2.0 million—are uninsured
- 27 percent of children living in low-income families—8.1 million—are covered by private insurance
- 72 percent of children living in low-income families—22.1 million—are covered by public insurance
Endnotes
This fact sheet is part of the National Center for Children in Poverty’s demographic fact sheet series and is updated annually. Unless otherwise noted, analysis of the 2015 American Community Survey (ACS) was conducted by Yang Jiang and Maribel R. Granja of NCCP. Estimates include children living in families with at least one parent and most children living apart from both parents. Children living independently, living with a spouse, in the foster care system, or in group quarters are excluded from these data. Children ages 14 years and under living with only unrelated adults were not included because data on their income status were not available. For children who do not live with at least one parent (for example, children being raised by grandparents), parental characteristics are calculated based on those of the householder and/or the householder’s spouse. We would like to thank Renée Wilson-Simmons, NCCP Director, for her advice on this fact sheet and both Seth Hartig and Suma Setty for data checks and proofreading. Special thanks to Diana Gazzia for layout and production.
1. United States Census Bureau, 2015 American Community Survey 1-Year Estimates (2016). Table S1701: Poverty Status In the Past 12 Months. Washington, DC: United States Census Bureau. Retrieved November 2016 from http://factfinder.census.gov/faces/tableservices/jsf/pages/productview.xhtml?pid=ACS_15_1YR_S1701&prodType=table. While these numbers reflect the total number of children in poverty, the remaining numbers in this report include only children living in families, as defined in the note above. In this fact sheet, poverty is defined as family income less than 100 percent of the federal poverty threshold, as determined by the U.S. Census Bureau; low income is defined as family income less than 200 percent of the poverty threshold.
2. The U.S. Census Bureau issues the poverty thresholds annually. Thresholds vary by family size and composition. See http://www.census.gov/data/tables/time-series/demo/income-poverty/historical-poverty-thresholds.html for the complete 2015 poverty thresholds.
3. Cauthen, Nancy K. & Fass, Sarah. (2008). Measuring Income and Poverty in the United States. New York, NY: National Center for Children in Poverty, Columbia University, Mailman School of Public Health.
4. Estimates from the Economic Policy Institute’s Family Budget Calculator. Retrieved November 2016 from http://www.epi.org/resources/budget/.
5. In the most recent ACS, parents could report children’s race as one or more of the following: “White,” “Black,” “American Indian or Alaska Native,” or “Asian and/or Hawaiian/Pacific Islander.” In a separate question, parents could report whether their children were of Hispanic origin. For the data reported, children whose parent reported their race as White, Black, American Indian or Alaska Native, or Asian and/or Hawaiian/Pacific Islander and their ethnicity as non-Hispanic were assigned a non-Hispanic category of their race. Children who were reported to be of more than one race were assigned as Other. Children whose parent identified them as Hispanic were categorized as Hispanic, regardless of their reported race.
6. The variable “native-born parents” is defined to mean that both parents in the family were born in the U.S. or its territories, or born abroad to American parent(s). The variable “immigrant parents” is defined to mean that at least one parent in the family is either a U.S. citizen by naturalization or is not a citizen of the U.S.
7. Parents’ employment is defined as the employment level of the parent in the household who maintained the highest level of employment in the previous year. Parents can either have no employment in the previous year, part-year or part-time employment, or full-time, year-round employment. Part-year or part-time employment is defined as either working less than 50 weeks in the previous year or less than 35 hours per week. Full-time, year-round employment is defined as working at least 50 weeks in the previous year and 35 hours or more per week.
8. Parents’ education is defined as the education level of the most highly educated parent(s) living in the household. Parents can either have no high school degree, a high school degree but no college, or some college or more.
9. Aratani, Yumiko. (2009). Homeless Children and Youth. New York, NY: National Center for Children in Poverty, Columbia University, Mailman School of Public Health.
10. People can report more than one type of insurance coverage. Children not covered by private or public health insurance at the time of the survey are considered uninsured.
11. Schwarz, Susan Wile. (2009). Adolescent Mental Health in the United States. New York, NY: National Center for Children in Poverty, Columbia University, Mailman School of Public Health.