Learn about our Making Work Supports Work project.
Millions of parents find themselves struggling to make ends meet, despite hard work. Even a full-time job is no guarantee of economic security, with the high cost of everyday expenses and a federal minimum wage of just $6.55 an hour – less than $14,000 a year with full-time, year-round employment.
The Basic Needs Budgets developed by the National Center for Children in Poverty (NCCP) show the cost of basic day-to-day necessities for families with children. Using examples from these bare-bones budgets, this brief examines the question of how much families need to get by and provides insight into the struggles that working families face. Examples are drawn from 12 localities and are based on families with two children; budgets for other family types and localities are available through NCCP’s Basic Needs Budget Calculator.
Basic Needs Budgets show that it takes an income of about 1.5 to 3.5 times the official poverty level ($22,050 a year for a family of four), depending on locality, to cover the cost of a family’s minimum day-to-day needs. The largest expenses are typically child care and housing, although health care and transportation can cost nearly as much – and in some cases more. While the struggle to make ends meet is particularly difficult for single parents, paying the bills is a tough challenge for two-parent families as well.
Basic Needs Budget Calculator
NCCP’s Basic Needs Budget Calculator provides access to budgets for 76 localities across 12 states, with more states coming soon. Users select the number of parents and number and ages of the family’s children. Budgets assume that all families include at least one full-time worker; for two-parent families, users make choices about the employment status of the other parent. Users may also substitute their own numbers for one or more expense estimates, and the Calculator adjusts the family’s tax liability and overall budget totals accordingly.
How much does it take to get by?
The cost of living varies dramatically both within and across states. To make ends meet in the large, high-cost cities of Chicago, New York, and San Francisco, for example, a two-parent family with two children (one preschool-aged and one school-aged) needs an income of $52,000 to $67,000 a year. Some smaller cities, such as Burlington, VT, cost just as much. That means two full-time workers earning at least $13 an hour each.
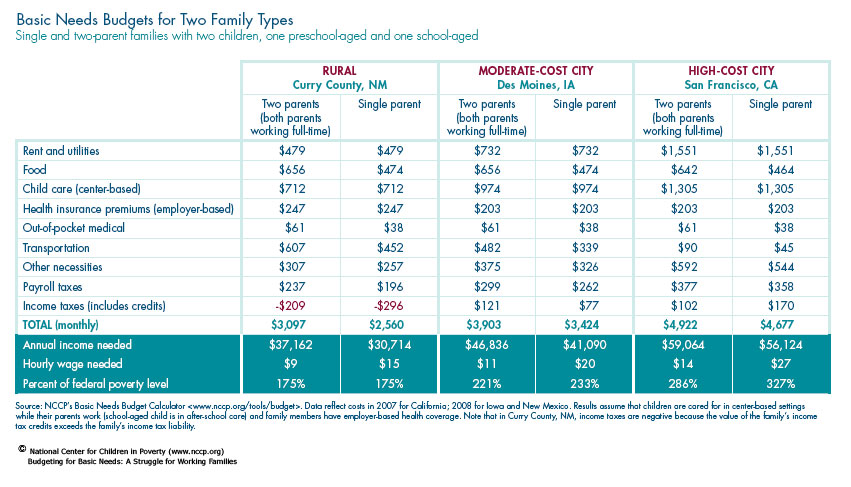
In more moderate-cost cities, the same family needs about $45,000 to $47,000 a year to cover the cost of day-to-day necessities. Des Moines, Detroit, San Antonio, and Tampa fall into this range. The cost of living is typically less in rural areas, though there is wide variation across the country.
In the low-cost rural areas of Alamosa County, CO, Curry County, NM, and East Carroll Parish, LA, a two-parent family with two children can make ends meet with an income of $35,000 to $37,000 a year. In rural Grays Harbor County, WA, a Basic Needs Budget for this family is higher: $41,000 a year, or two full-time, year-round jobs paying $10 an hour.
For a single parent, making ends meet presents an even greater challenge. While family expenses are somewhat lower, there is only one worker to shoulder the cost. As seen in Figure 1, a single parent with two children needs to earn $15 an hour to afford basic necessities in a rural area of New Mexico, $20 an hour in Des Moines, and $27 in San Francisco.
The Day-to-Day Struggle
Monica and Sam Patterson live in Des Moines with their two daughters. Both parents are employed full-time and earn $10 per hour. Together, their income totals about $42,000 a year before taxes, and Monica’s job provides affordable family health insurance. The Pattersons rent a modest two-bedroom apartment, rarely use their cars except to commute to work, and never go out to eat. The younger daughter, who is three, goes to a child care center while her parents work; the older daughter is in after-school care.
Despite working full time, Monica and Sam cannot make ends meet. Without enough money to cover the cost of rent, food, child care, health care, transportation, and other necessities (see box), Monica and Sam are forced to compromise on the basics. Moreover, any unexpected expense or small loss in wages – due to an illness or car trouble, for example – leaves them in the red.
Basic Needs Budget for the Patterson Family
| Annual | Monthly | |
|---|---|---|
| Rent and Utilities | $8,784 | $732 |
| Food | $7,878 | $656 |
| Child Care (center-based) | $11,682 | $974 |
| Health Insurance (employer-based) | $2,436 | $203 |
| Out-of-pocket medical | $732 | $61 |
| Transportation | $5,788 | $482 |
| Other Necessities | $4,499 | $375 |
| Debt | $0 | $0 |
| Payroll | $3,583 | $299 |
| Income Taxes (includes credits) | $1,455 | $121 |
| TOTAL | $46,836 | $3,903 |
| Hourly wage needed (per parent): $11 Percent of the federal poverty level: 221% |
||
Where does the money go?
Basic Needs Budgets include only day-to-day necessities: housing, food, transportation, child care, health care, payroll and income taxes, and a little more for other necessities such as clothing and school supplies. They do not include durable goods – such as furniture or household appliances – nor enrichment activities, entertainment, or other expenses that improve a family’s quality of life. They do not allow for investments in a family’s future, such as savings for a home, a child’s education, or a parent’s retirement. And they do not provide any resources to pay off debt nor a financial cushion to withstand a crisis. Nonetheless, even these budgets are beyond the reach of many working families.
Child care is often the single largest expense that families face. This is true in nearly 90 percent of NCCP’s Basic Needs Budgets for a family with a preschool-aged and a school-aged child (assuming children are cared for in a center-based setting). Other research confirms that in 49 states, the cost of child care for two children of any age exceeds median rent costs. Depending on where a family lives, the cost of care for one preschool-aged and one school-aged child can range from under $600 a month to more than $1,500 – or about $7,000 to $20,000 a year. As seen in Figure 2, that’s about 20 to 35 percent of a total Basic Needs Budget. (Note that the budgets presented in Figure 2 assume that family members have employer-based health insurance; see more on this issue below.)
After the cost of child care, housing is generally families’ next largest expense, with rent and utilities comprising about 20 percent of a family’s total basic budget. Food and transportation are significant costs too, rivaling the cost of housing in some places. Transportation costs can be especially burdensome in rural areas where parents often have to drive long distances to reach their jobs. In some of the highest cost cities, on the other hand, public transportation makes commuting much more affordable.
Taxes can take a large bite out of families’ budgets as well, and for families who are just barely making ends meet, payroll taxes are virtually always higher than income taxes. In part this is because income taxes are offset by tax credits, such as the federal Earned Income Tax Credit, the Child Tax Credit, and the Child and Dependent Care Tax Credit, as well as similar state- and local-level credits. Basic Needs Budgets assume that families receive all of the income tax credits for which they are eligible. It is important to note that other types of state and local taxes – such as sales and excise taxes – are not reflected in these budgets.
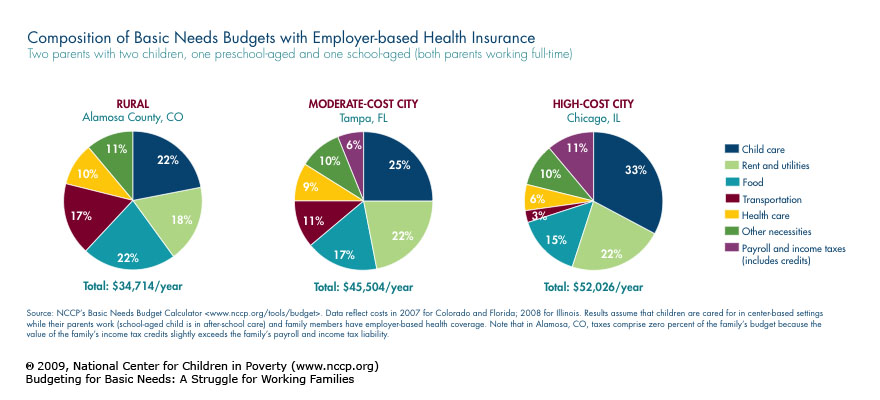
Finally, the cost of health insurance is relatively low in Figure 2 – about 5 to 10 percent of a family’s total budget – because these budgets assume that the family has employer-based health coverage. In practice, employer-based health plans are becoming increasingly unavailable, and the majority of low-income workers lack such benefits.
As seen in Figure 3, Basic Needs Budgets for families who do not have employer-based health benefits look significantly different. The budgets shown here are the same as those in Figure 2 with one exception: they assume that family members do not have access to employer-based health benefits and must buy coverage on the open market.
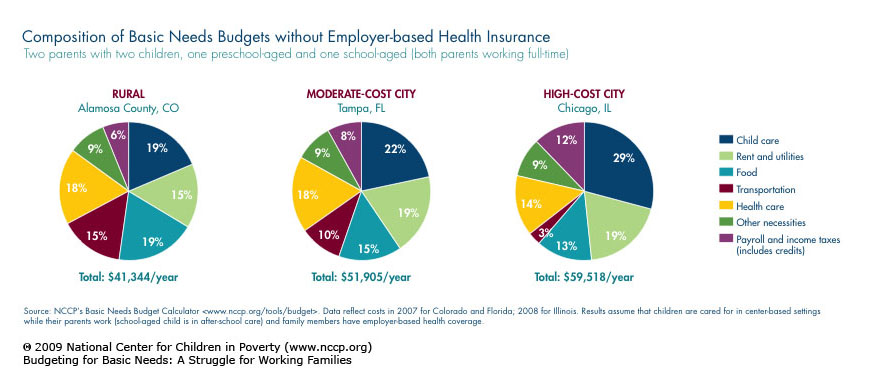
Private, nongroup health insurance can cost as much as – or even more than – rent. The high cost of coverage not only consumes a large portion of a family’s budget, but also has a substantial impact on budget totals. In Alamosa County, assuming nongroup versus employer-based health coverage increases the size of the family’s budget by nearly 20 percent, from $35,000 to $41,000 a year. In Chicago, the cost of basic necessities for two parents with two children rises from $52,000 to $60,000 a year. In practice, the high cost of nongroup coverage means that many low- and moderate-income workers find themselves and their family members uninsured.
What if one parent stays home?
While single parents are both the primary breadwinners and primary caretakers for their families, two-parent families potentially have more options as they seek to balance the demands of work and family. One parent may take a part-time job, for example, or stay home full-time to care for the children. Basic Needs Budgets show that by reducing or eliminating the need for child care, this can significantly bring down the family’s expenses. Transportation costs are also lower without two full-time commutes, and families with lower earnings owe less in taxes. (See Figure 4; note that these budgets assume employer-based health insurance.)
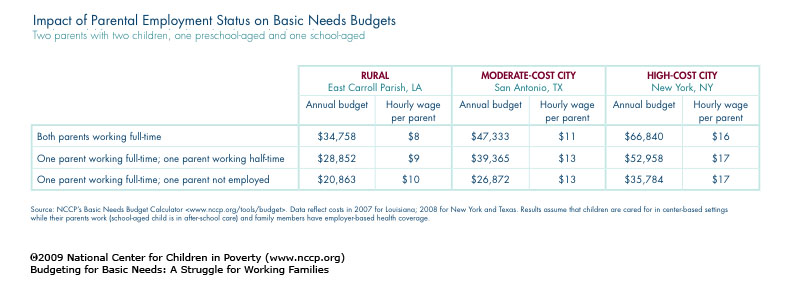
But despite reduced expenses when one parent stays home full- or part-time, a higher hourly wage is needed to make ends meet. In San Antonio, for example, a two-parent family with two children can cover a basic budget if both parents work full-time, earning $11 an hour each. But with just one parent employed full-time, that parent needs to earn $13 an hour. In practice, in two-thirds of the country’s two-parent families, both parents are employed.
Interestingly, Basic Needs Budgets indicate that families with one full-time worker may need the same hourly wage, whether the second parent is employed half-time or not at all. This is because the additional earnings from a part-time job can be canceled out by the resultant increases in child care and other work-related expenses.
How do family budgets change as children grow older?
The analyses above are based on families with one preschool-aged child and one school-aged child. As children grow older, families’ expenses change. Most significantly, older children generally need less child care. The result is that a two-parent family with two children needs more to make ends meet when both children are preschool-aged, for example, than when one enters school (see Figure 5). At the same time, parents with the youngest children are likely to earn the least – and this is also when the impact of economic hardship can be most devastating for children’s development.
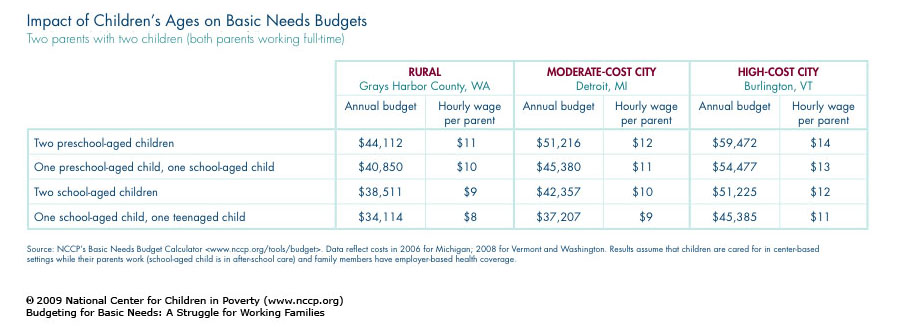
Figure 5 also shows that even families with one school-aged child (under age 13) and one teenager need two full-time jobs paying well above the federal minimum wage just to cover day-to-day necessities. To save for their children’s college education or for their own retirement, parents need to earn far more. Finally, Figure 5 looks at wages for families with two full-time earners.
A single parent needs a much higher-paying job to make ends meet, regardless of her children’s ages. In Detroit, for example, a single parent with two preschool-aged children needs to earn $47,000 a year just to cover basic expenses. That’s the equivalent of full-time, year-round employment at $22 an hour. With one school-aged child and one teenager, the cost of basic family expenses falls, but the parent still needs a $15-an-hour job to afford minimum day-to-day necessities.
What does this mean for America’s families?
Millions of America’s families scrape by on less than what it takes to cover their basic needs. Parents may find cheaper, but potentially less reliable and lower quality, care for their children. They may live in overcrowded housing or in unsafe neighborhoods – or get behind on rent or utility bills. These are tough choices that jeopardize the well-being of our nation’s children and families.
America’s families need access to high quality jobs with decent wages and benefits. They also need a comprehensive work support system designed to address the challenges faced by those who struggle to afford basic necessities, despite working full-time. And that struggle is only growing as the cost of basics, such as food and health care, rises.
Endnotes
1. This figure is from the federal poverty guidelines, issued by the U.S. Department of Health and Human Services and used for benefit eligibility determinations and other administrative purposes. The poverty thresholds issued by the U.S. Census Bureau, which are used for research and statistical purposes, differ slightly. For more information, see www.aspe.hhs.gov/ POVERTY/09poverty.shtml.
2. Here and below, a “school-age child” refers to a child ages 6 through 12 years. For a detailed description of how the cost of basic family needs is estimated, see “Basic Needs Budget Methodology.”
3. Breaking the Piggy-Bank: Parents and the High Price of Child Care. 2006. Arlington, VA: National Association of Child Care Resource and Referral Agencies.
4. Clemans-Cope, Lisa; Garrett, Bowen; Hoffman, Catherine. 2006. Changes in Employees’ Health Insurance Coverage, 2001-2005. Washington, DC: Kaiser Commission on Medicaid and the Uninsured, Henry J. Kaiser Family Foundation.
5. Gould, Elise. 2008. The Erosion of Employer-Sponsored Health Insurance: Declines Continue for the Seventh Year. Washington, DC: Economic Policy Institute.
6. NCCP analysis based on the U.S. Current Population Survey, Annual Social and Economic Supplements, March 2008 representing data for calendar year 2007.
7. In reality, the child care needs of families with two working parents vary significantly based on parents’ work patterns. Basic Needs Budgets assume that in families with two employed parents, parents’ work schedules overlap. Family child care needs are estimated based on the work hours of the parent who works the fewest hours.
8. Basic Needs Budgets assume that school-aged children (ages 6 through 12) need about half the amount of care needed by preschool-aged children, while children over age 12 do not need child care.
9. Parents with younger children are likely to be younger themselves and thus earn less than parents with older children. For more on the impact of economic hardship on young children, see Knitzer, Jane. 2007. Testimony on the Economic and Societal Costs of Poverty. Prepared for the Committee on Ways and Means, House of Representatives.
10. Cauthen, Nancy K.; Fass, Sarah. 2008. Ten Important Questions about Child Poverty and Family Economic Hardship. New York, NY: National Center for Children in Poverty, Columbia University, Mailman School of Public Health.
11. NCCP’s Making Work Supports Work project seeks to promote a comprehensive national work support system that enables full-time workers to provide for their families and ensures that earning more always improves a family’s financial bottom line. For more, see the Making Work Supports Work project. For a discussion of a comprehensive approach to work supports, see Cauthen, Nancy K. 2007. Improving Work Supports: Closing the Financial Gap for Low-Wage Workers and Their Families. Washington, DC: Agenda for Shared Prosperity, Economic Policy Institute.