To find comparable information for all children, see Basic Facts about Low-Income Children: Children under 18 Years, 2012; for young children, see Basic Facts about Low-Income Children: Children under 6 Years, 2012; for middle children, see Basic Facts about Low-Income Children: Children 6 through 11 Years, 2012; for adolescent children, see Basic Facts about Low-Income Children: Children 12 through 17 Years, 2012.
Children under 18 years represent 23 percent of the population, but they comprise 34 percent of all people in poverty. Among all children, 45 percent live in low-income families and approximately one in every five (22 percent) live in poor families. Our very youngest children – infants, and toddlers under age 3 years – appear to be particularly vulnerable, with 48 percent living in low-income families, including 25 percent living in poor families. Being a child in a low-income or poor family does not happen by chance. Parental education and employment, race/ethnicity, and other factors are associated with children’s experience of economic insecurity. This fact sheet describes the demographic, socio-economic, and geographic characteristics of children and their parents. It highlights important factors that appear to distinguish low-income and poor children from their less disadvantaged counterparts.
How many infants and toddlers under 3 years old in the United States live in low-income families?
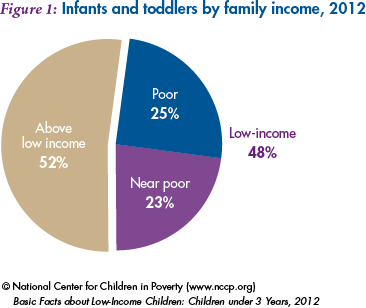
There are more than 11 million infants and toddlers under age 3 years in the United States, about 16 percent of the total child population.
- 48 percent – 5.4 million – live in low-income families
- 25 percent – 2.8 million – live in poor families
What is the 2012 federal poverty threshold (FPT)?
- $23,364 for a family of four with two children
- $18,480 for a family of three with one child
- $15,825 for a family of two with one child
Is a poverty-level income enough to support a family?
Research suggests that, on average, families need an income equal to about two times the federal poverty level to meet their most basic needs. Families with incomes below this level are referred to as low income:
- $46,728 for a family of four with two children
- $36,960 for a family of three with one child
- $31,650 for a family of two with one child
These dollar amounts approximate the average minimum income families need to make ends meet, but actual expenses vary greatly by locality. In 2010-2011, the cost of meeting basic needs for a family of four was about $64,000 per year in Los Angeles, California; $57,000 in Newark, New Jersey; $46,000 in Indianapolis, Indiana; and $42,000 in Jackson, Mississippi.
Has the percentage of infants and toddlers living in low-income and poor families changed over time?
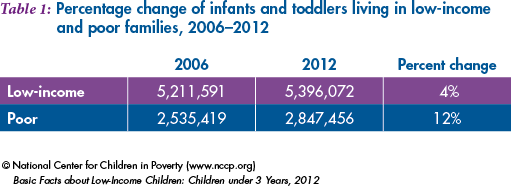
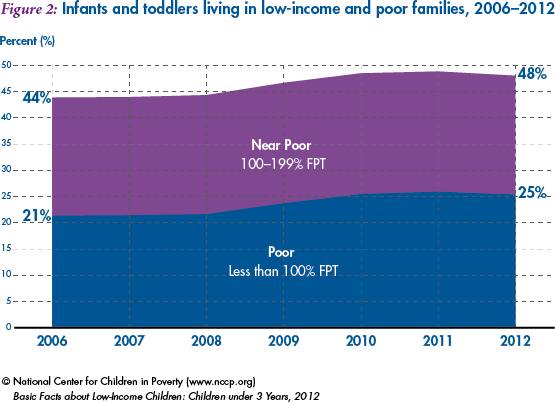
The percentage of infants and toddlers living in low-income families (both poor and near poor) has been on the rise – increasing from 44 percent in 2006 to 48 percent in 2012 (Figure 2). During this time period, the overall number of the very youngest children (children under age 3 years) decreased by 5 percent, while the numbers who were low-income and poor increased by 4 percent and 12 percent, respectively (Table 1).
How do infants and toddlers compare to the rest of the population?
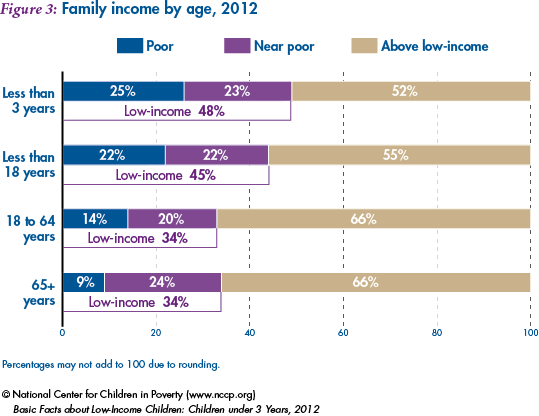
The percentage of infants and toddlers in low-income families surpasses that of adults. In addition, children under age 3 years are nearly three times as likely as adults 65 years and older to live in poor families (Figure 3).
Does the percentage of children in low-income families vary by children’s age?
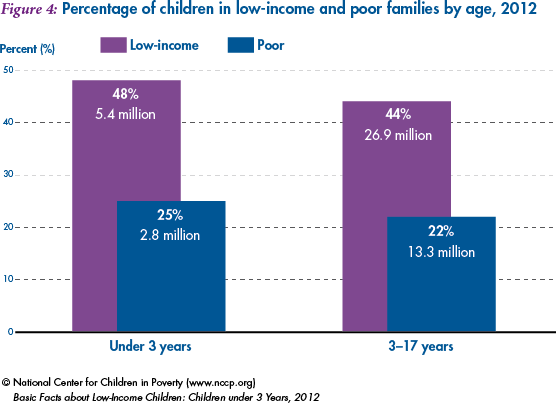
The percentages of children under 18 years who live in low-income and poor families vary by age group. Children under age 3 are more likely to live in low-income and poor families than older children (Figure 4).
- 48 percent of children under age 3 years – 5.4 million – live in low-income families
- 25 percent of children under age 3 years – 2.8 million – live in poor families
- 44 percent of children age 3 through 17 years – 26.9 million – live in low-income families
- 22 percent of children age 3 through 17 years -13.3 million – live in poor families
Does the percentage of infants and toddlers in low-income families vary by race/ethnicity?
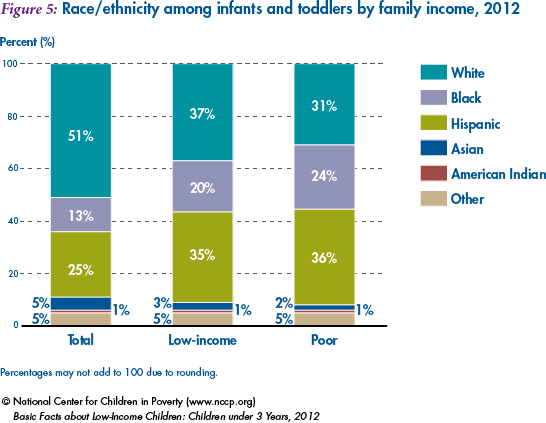
As Figure 5 illustrates, the percentages of low-income and poor infants and toddlers vary by race and ethnicity: whites comprise the largest share of all low-income children (37 percent) while Hispanics make up the largest share of poor children (36 percent).
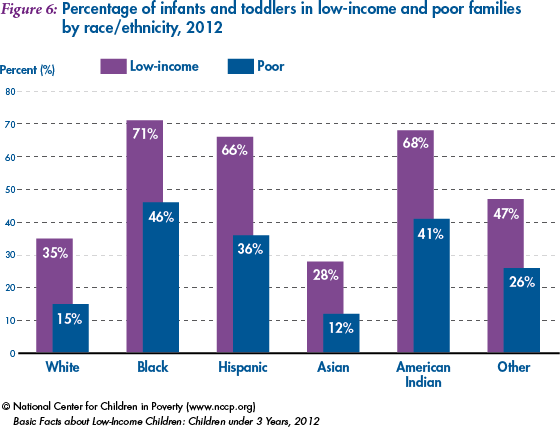
But black, American Indian, and Hispanic children are disproportionately low-income and poor (Figure 6).
- 35 percent of white infants and toddlers – 2.0 million – live in low-income families
- 71 percent of black infants and toddlers – 1.1million – live in low-income families
- 66 percent of Hispanic infants and toddlers – 1.9 million – live in low-income families
- 28 percent of Asian infants and toddlers – about 0.1 million – live in low-income families
- 68 percent of American Indian infants and toddlers – about 57,000 – live in low-income families
- 47 percent of infants and toddlers of some other race – 0.3 million- live in low-income families
Does the percentage of infants and toddlers in low-income families vary by parents’ country of birth?
- 56 percent of infants and toddlers with immigrant parents – 1.5 million – live in low-income families
- 46 percent of infants and toddlers with native-born parents – 3.9 million – live in low-income families
What are the family characteristics of low-income and poor infants and toddlers?
Parents’ Education
Higher levels of parental education decrease the likelihood that a child will live in a low-income or poor family. Among infants and toddlers with at least one parent with some college or additional education, 34 percent live in low-income and 15 percent in poor families. By contrast, among children in this age group whose parents have less than a high school degree, 88 percent live in low-income and 61 percent in poor families (Figure 8).
- 88 percent of infants and toddlers with parents who have less than a high school degree – 1.1 million – live in low-income families
- 74 percent of infants and toddlers with parents who have a high school degree but no college – 1.6 million – live in low-income families
- 34 percent of infants and toddlers with at least one parent who has some college or additional education – 2.6 million – live in low-income families
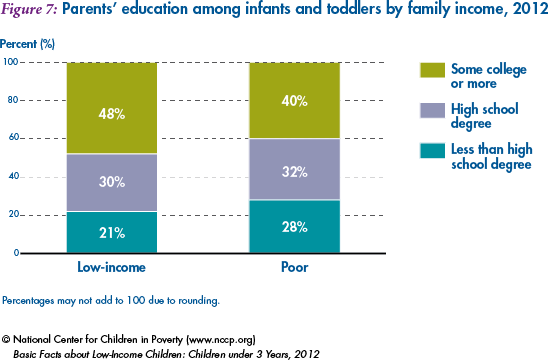
At the same time, significant shares of low-income and poor families with infants and toddlers are headed by parents with at least some college education, as shown in Figure 7.
Parents’ Employment
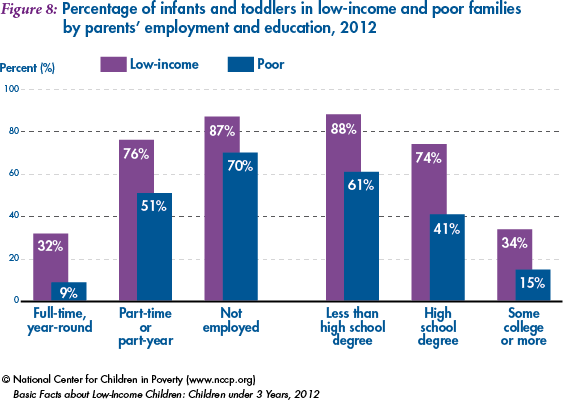
Infants and toddlers with a full-time, year-round employed parent are less likely to live in a low-income family, compared to infants and toddlers with parents who work part-time/part-year or who are not employed (Figure 8).
- 32 percent of infants and toddlers with at least one parent who works full-time, year-round – 2.4 million – live in low-income families
- 9 percent of infants and toddlers with at least one parent who works full-time, year-round – 0.7 million – live in poor families
- 76 percent of infants and toddlers with no parent who works full-time, but at least one parent who works part-time or part-year – 1.8 million – live in low-income families
- 51 percent of infants and toddlers with no parent who works full-time, but at least one parent who works part-time or part-year – 1.2 million – live in poor families
- 87 percent of infants and toddlers with no employed parents – 1.1 million – live in low-income families
- 70 percent of infants and toddlers with no employed parents – 0.9 million – live in poor families
Nevertheless, many low-income and poor infants and toddlers have parents who work full time. About 45 percent of low-income children and 25 percent of poor children under age 3 live with at least one parent employed full-time, year-round.
Family Structure
Forty-six percent of children under age 3 years in low-income families – 2.5 million – and 34 percent of children under age 3 years in poor families – 1.0 million – live with married parents. Children who live with two married parents are much less likely to be poor or low-income compared to children who live with a single parent.
- 34 percent of infants and toddlers residing with married parents – 2.5 million – live in low-income families
- 13 percent of infants and toddlers residing with married parents – 1.0 million – live in poor families
- 74 percent of infants and toddlers residing with a single parent – 1.9 million – live in low-income families
- 48 percent of infants and toddlers residing with a single parent – 1.2 million – live in poor families
Does the percentage of infants and toddlers in low-income families vary by where they live?
Region
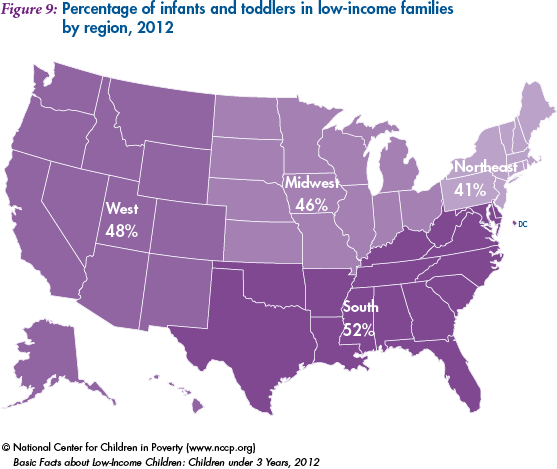
The percentage of infants and toddlers in low-income families varies substantially by region.
- 41 percent of infants and toddlers in the Northeast – 0.7 million – live in low-income families
- 46 percent of infants and toddlers in the Midwest – 1.1 million – live in low-income families
- 52 percent of infants and toddlers in the South – 2.2 million – live in low-income families
- 48 percent of infants and toddlers in the West – 1.3 million – live in low-income families
Residential Instability and Home Ownership
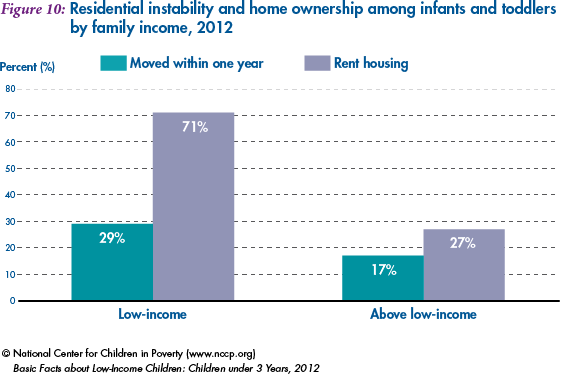
Research suggests that stable housing is important for healthy child development.9 However, infants and toddlers living in low-income families are more likely than other children to have moved in the past year and to live in families that rent, rather than own, a home (Figure 10).
- 29 percent of infants and toddlers in low-income families – 1.6 million – moved in the last year
- 17 percent of infants and toddlers in families above the low-income threshold – 1.0 million – moved in the last year
- 71 percent of infants and toddlers in low-income families – 3.8 million – live with a family that rents a home
- 27 percent of infants and toddlers in families above the low-income threshold – 1.6 million – live with a family that rents a home
Are infants and toddlers in low-income families covered by health insurance?
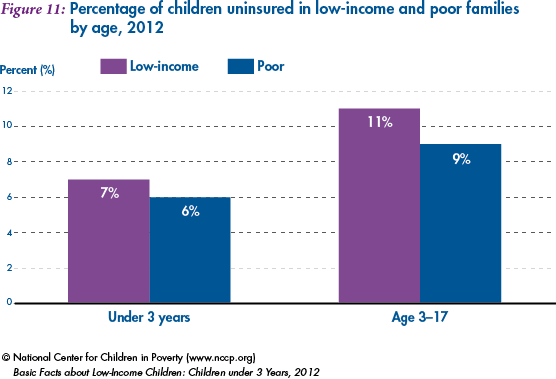
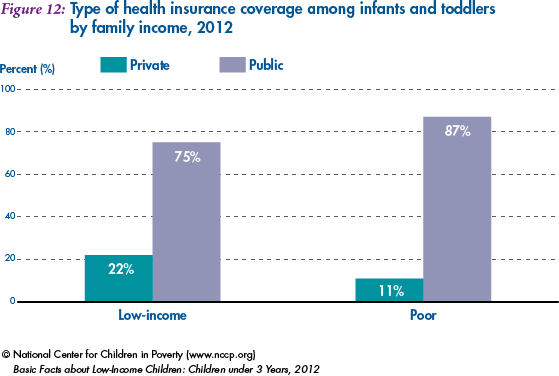
Among all infants and toddlers, approximately 7 percent living in low-income families and 6 percent living in poor families are uninsured. Consistent with research suggesting older children are particularly at risk of being uninsured, infants and toddlers are less likely to be without health insurance coverage compared to older children (Figure 11). Public insurance reaches the largest share of economically disadvantaged infants and toddlers, covering about three-fourths (75 percent) of these children in low-income families and 87 percent of these children in poor families (Figure 12).
- 7 percent of infants and toddlers living in low-income families – 0.3 million – are uninsured
- 22 percent of infants and toddlers living in low-income families – 1.2 million – are covered by private insurance
- 75 percent of infants and toddlers living in low-income families – 4.1 million – are covered by public insurance
Endnotes
This fact sheet is part of the National Center for Children in Poverty’s demographic fact sheet series and is updated annually. Unless otherwise noted, analysis of the 2012 American Community Survey (ACS) was conducted by Yang Jiang and Mercedes Ekono of NCCP. Estimates include children living in households with at least one parent and most children living apart from both parents (for example, children being raised by grandparents). Children living independently, living with a spouse, or in group quarters are excluded from these data. Children age 14 years and under living with only unrelated adults were not included because data on their income status were not available. Among children who do not live with at least one parent, parental characteristics are those of the householder and/or the householder’s spouse. We would like to thank Renée Wilson-Simmons, NCCP director, for her advice on this fact sheet. Special thanks to Telly Valdellon for layout and production.
1. In this fact sheet, poverty is defined as family income less than 100 percent of the federal poverty threshold, as determined by the U.S. Census Bureau; low income is defined as family income less than 200 percent of the poverty threshold.
2. The U.S. Census Bureau issues the poverty thresholds annually. Thresholds vary by family size and composition. See http://aspe.hhs.gov/poverty/12poverty.shtml for the complete 2012 poverty thresholds.
3. Cauthen, Nancy K. & Fass, Sarah. (2008). Measuring Income and Poverty in the United States. New York, NY: National Center for Children in Poverty, Columbia University, Mailman School of Public Health.
4. These figures were derived from NCCP’s Basic Needs Budget Calculator.
5. In the most recent ACS, parents could report children’s race as one or more of the following: “White,” “Black,” “American Indian or Alaska Native,” or “Asian and/or Hawaiian/Pacific Islander.” In a separate question, parents could report whether their children were of Hispanic origin. For the data reported, children whose parent reported their race as White, Black, American Indian or Alaska Native, or Asian and/or Hawaiian/Pacific Islander and their ethnicity as non-Hispanic were assigned a non-Hispanic category of their race. Children who were reported to be of more than one race were assigned as Other. Children whose parent identified them as Hispanic were categorized as Hispanic, regardless of their reported race.
6. The variable “native-born parents” is defined to mean that both parents in the family were born in the U.S. or its territories, or born abroad to American parent(s). The variable “immigrant parents” is defined to mean that at least one parent in the family is either a U.S. citizen by naturalization or is not a citizen of the U.S.
7. Parents’ education is defined as the education level of the most highly educated parent(s) living in the household. Parents can either have no high school degree, a high school degree but no college, or some college or more.
8. Parents’ employment is defined as the employment level of the parent in the household who maintained the highest level of employment in the previous year. Parents can either have no employment in the previous year, part-year or part-time employment, or full-time, year-round employment. Part-year or part-time employment is defined as either working less than 50 weeks in the previous year or less than 35 hours per week. Full-time, year-round employment is defined as working at least 50 weeks in the previous year and 35 hours or more per week.
9. Aratani, Yumiko. (2009). Homeless Children and Youth. New York, NY: National Center for Children in Poverty, Columbia University, Mailman School of Public Health.
10. People can report more than one type of insurance coverage. Children not covered by private or public health insurance at the time of the survey are considered uninsured.
11. Schwarz, Susan Wile. (2009). Adolescent Mental Health in the United States. New York, NY: National Center for Children in Poverty, Columbia University, Mailman School of Public Health.