To find comparable information for young children, see Basic Facts about Low-Income Children: Children Under 18 years, 2016.
Among all children under 18 years in the U.S., 41 percent live in low-income families and 19 percent—approximately one in five—are poor. This means that children are overrepresented among our nation’s poor; they represent 23 percent of the population but comprise 32 percent of all people in poverty. Many more children live in families with incomes just above the poverty threshold.
Young children—those under age 9 years—appear to be particularly vulnerable, with 44 percent living in low-income families, including 21 percent living in poor families. Being a child in a low-income or poor family does not happen by chance. Parental education and employment, race/ethnicity, and other factors are associated with children’s experience of economic insecurity. This fact sheet describes the demographic, socioeconomic, and geographic characteristics of young children and their parents. It highlights important factors that appear to distinguish low-income and poor young children from their less disadvantaged counterparts.
How many young children under age 9 years live in low-income families in the United States?
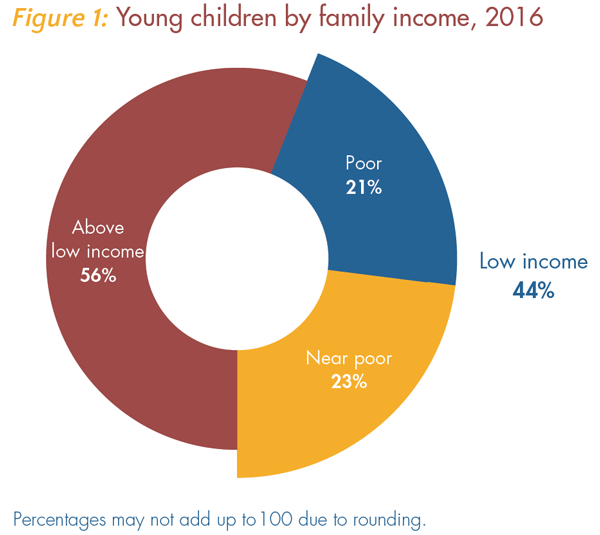
There are more than 15 million children under age 9 years who live in low-income families in the United States.
Note: Above low income is defined as at or above 200% of the federal poverty threshold (FPT), poor is defined as below 100% of FPT, and near poor is between 100% and 199% of the FPT. The low-income category includes both the poor and the near poor.
What is the 2016 federal poverty threshold (FPT)?
- $24,339 for a family of four with two children
- $19,318 for a family of three with one child
- $16,543 for a family of two with one child
Is a poverty-level income enough to support a family?
Research suggests that, on average, families need an income equal to about two times the federal poverty threshold to meet their most basic needs. Families with incomes below this level are referred to as low income:
- $48,678 for a family of four with two children
- $38,636 for a family of three with one child
- $33,086 for a family of two with one child
These dollar amounts approximate the average minimum income families need to make ends meet, but actual expenses vary greatly by locality. In 2014, the cost of meeting basic needs for a family of four required about $85,800 per year in Boston, Massachusetts; $61,500 in Akron, Ohio; $57,200 in Tulsa, Oklahoma; and $53,600 in McAllen, Texas.
Has the percentage of young children living in low-income and poor families changed over time?
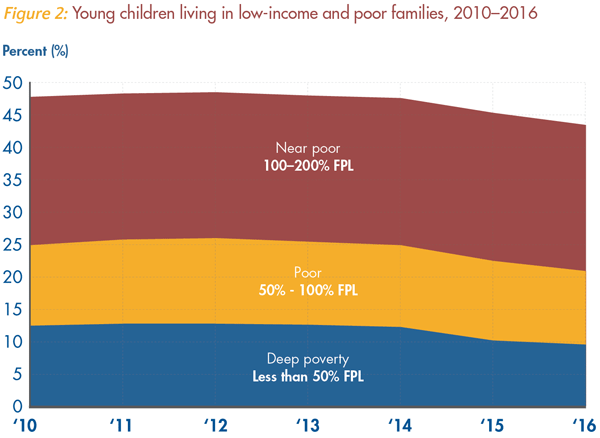
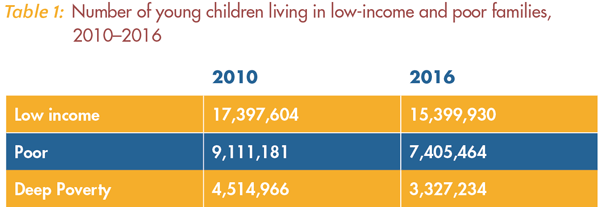
The percentage of low-income young children (both poor and near poor) decreased from 48 percent in 2010 to 44 percent in 2016, and has decreased from a high of 49 percent in 2012 (Figure 2). Between 2010 and 2016, the overall number of young children (children under age 9) decreased from 36.4 million to 35.4 million. The number of low-income, young children decreased from 17.4 million to 15.4 million, the number of poor, young children decreased from 9.1 million to 7.4 million, and the number of young children living in deep poverty, defined as less than 50 percent of the federal poverty threshold, decreased from 4.5 million to 3.3 million (Table 1).
How does the poverty status of young children compare to the rest of the population?
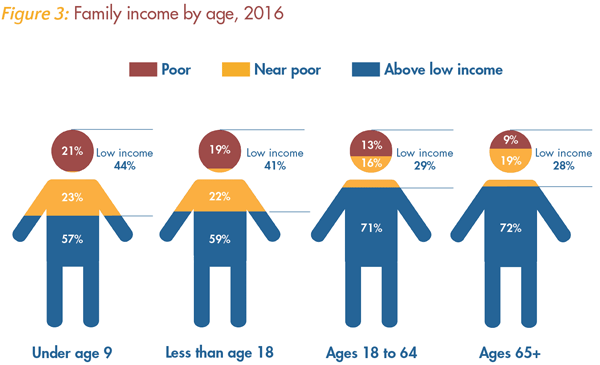
The percentage of young children in low-income families surpasses that of adults. In addition, young children are more than twice as likely as adults 65 years and older to live in poor families (Figure 3).
Does the percentage of young children in low-income families vary by age group?
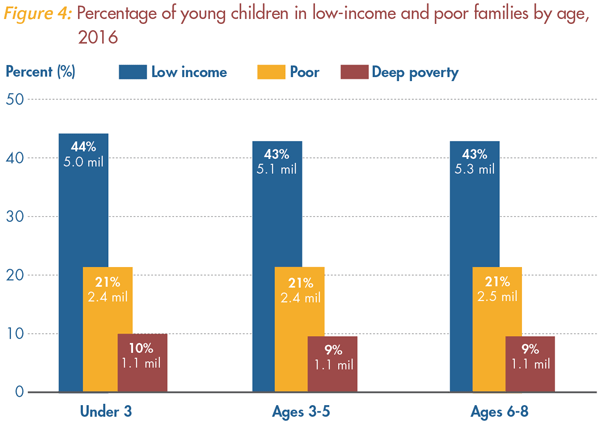
The percentage of poor, deep poor, or low-income young children is relatively stable when comparing across age groups (Figure 4).
Does the percentage of young children in low-income families vary by race/ethnicity?
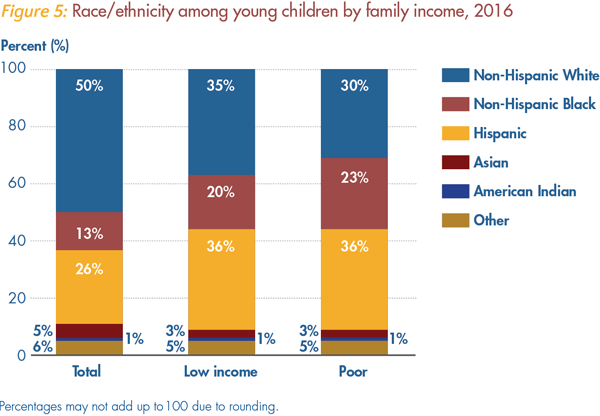
As Figure 5 illustrates, the percentages of low-income and poor young children varies by race and ethnicity. Hispanics comprise the largest share of young children living in low-income families (36 percent) and of poor children in this age group (also 36 percent).
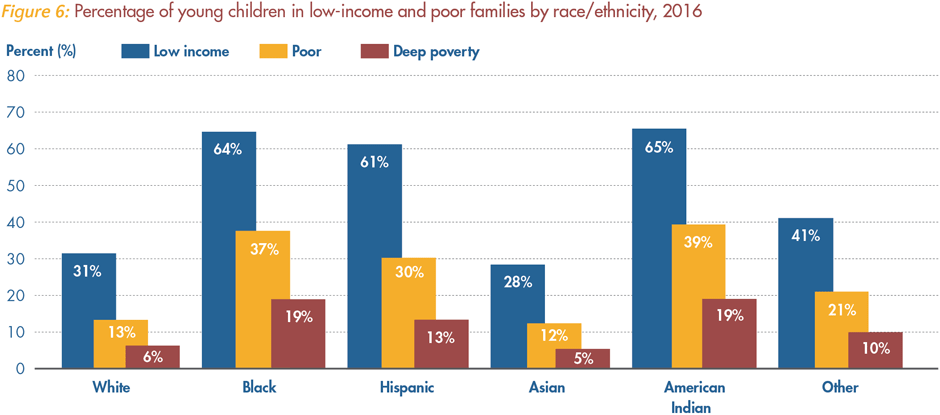
Black, American Indian, and Hispanic children are disproportionately low income and poor (Figure 6).
Does the percentage of young children in low-income families vary by parent nativity?
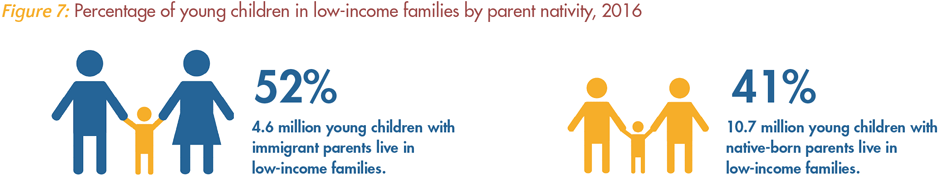
Children of immigrants are more likely to be low-income than children of native-born parents (Figure 7).
What are the family characteristics of low-income and poor young children?
Parent Employment
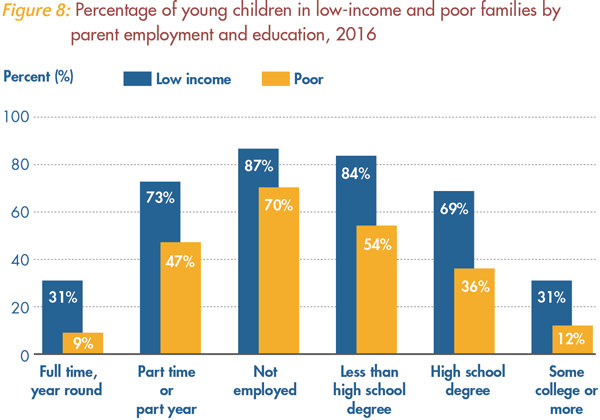
Young children with a full-time, year-round employed parent are less likely to live in a low-income family, compared to young children with parents who work part time/part year or who are not employed (Figure 8).
Nevertheless, many low-income and poor young children have parents who work full time. About 53 percent of low-income children and 31 percent of poor children under age 9 live with at least one parent employed full time, year round.
Parent Education
Higher levels of parental education decrease the likelihood that a child will live in a low-income or poor family. Among young children with at least one parent with some college or additional education, 31 percent live in low-income families and 12 percent live in poor families. By contrast, among children in this age group whose parents have less than a high school degree, 84 percent live in low-income and 54 percent live in poor families (Figure 8).
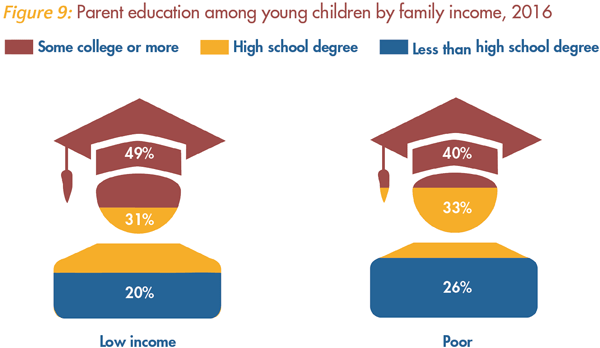
At the same time, significant shares of low-income and poor families with young children are headed by parents with at least some college education, as shown in Figure 9.
Family Structure
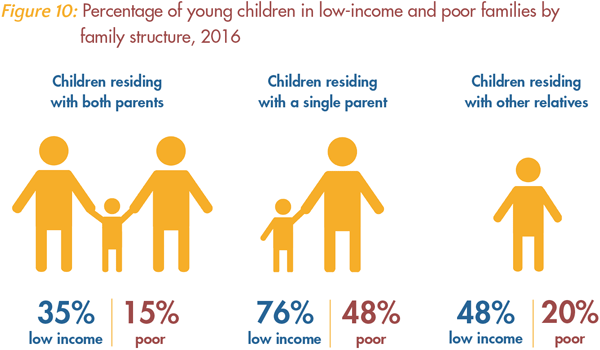
Fifty-eight percent of young children in low-income families—8.8 million—and 51 percent of young children in poor families—3.7 million—live with two parents. Children who live with two parents are much less likely to be poor or low income compared to children who live with one parent or neither parent (Figure 10).
Does the percentage of young children in low-income families vary by where they live?
Region
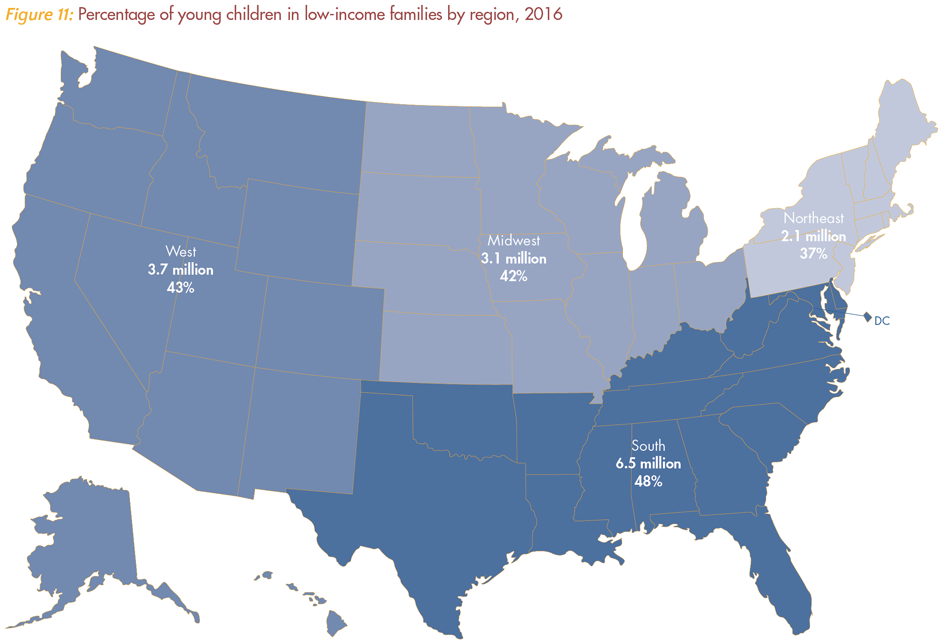
The percentage of low-income young children varies substantially by region (Figure 11).
Residential Instability and Home Ownership
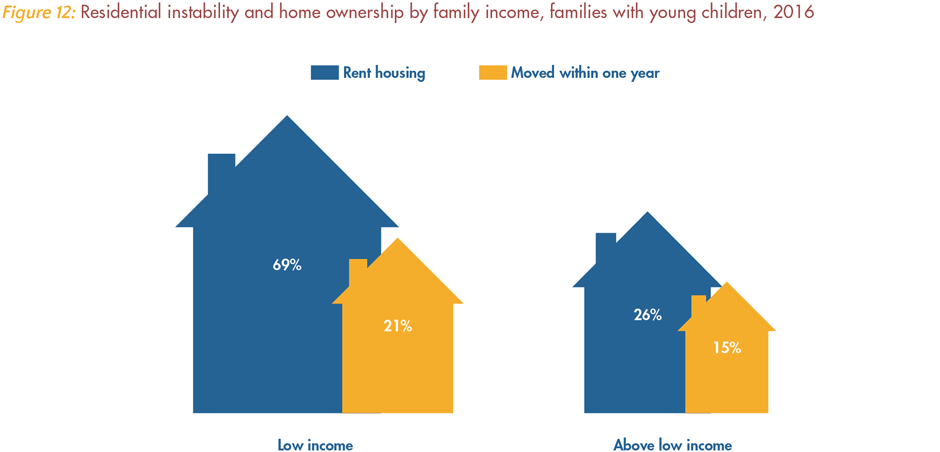
Research suggests that stable housing is important for healthy child development. However, young children living in low-income families are more likely than other young children to have moved in the past year and to live in families who rent, rather than own, their homes (Figure 12).
Energy and Housing Insecurity
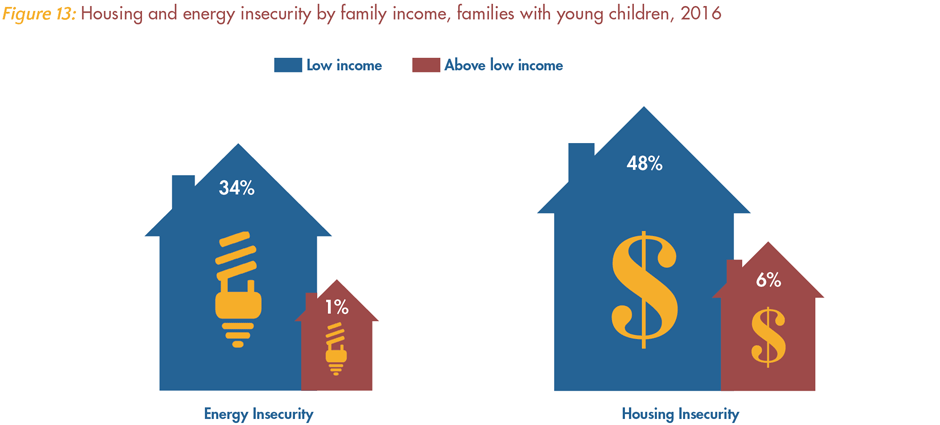
A much larger percent of low-income children experience energy and housing insecurity (Figure 13). Housing and energy insecurity means that their families have difficulty paying these expenses each month, leading to additional stress in the family.
Does preschool enrollment vary by family income for very young children?
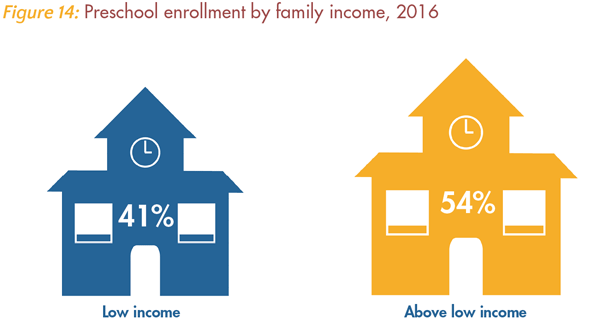
Very young children (ages 3-4) in low-income families are less likely to attend preschool compared to children in higher income families (Figure 14).
What proportion of low-income children are covered by health insurance?
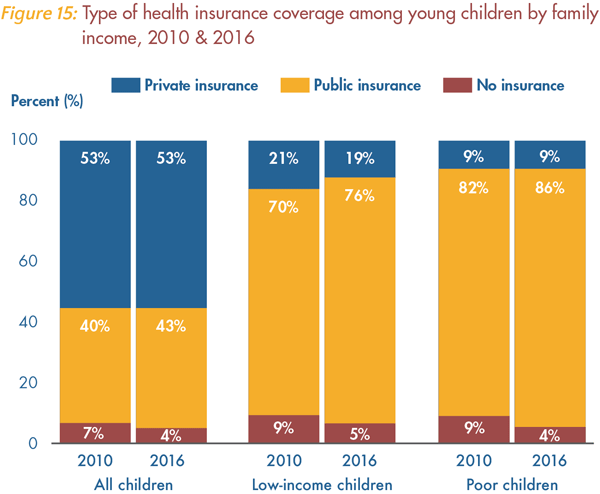
Among children under age 9, 5 percent of low-income children and 5 percent of poor children are uninsured. Public insurance programs cover 43 percent of young children, a slight increase since 2010 (Figure 15). They reach many more economically disadvantaged young children than private plans, covering 76 percent of low-income young children and 86 percent of poor young children.
What proportion of children in low-income families receive support from the Supplemental Nutrition Assistance Program (SNAP)?
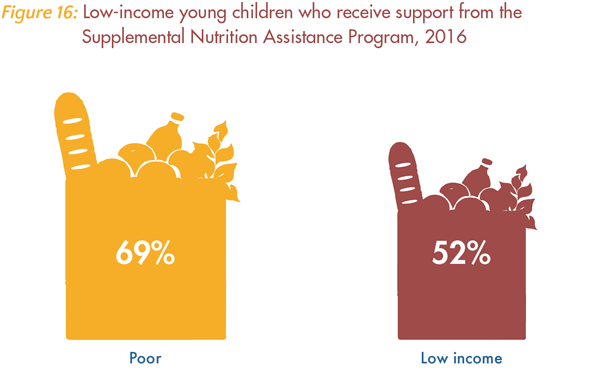
Among low-income children under age 9, more than half (52 percent) receive SNAP benefits (Figure 16). This percentage is slightly higher than the 51 percent of young children who received SNAP benefits in 2010, but represents a significant decline from the 55 percent of young children who received SNAP benefits in 2012 and 2013.
Endnotes
This fact sheet is part of the National Center for Children in Poverty’s demographic fact sheet series and is updated annually. Unless otherwise noted, analysis of the 2016 American Community Survey (ACS) was conducted by Yang Jiang. Estimates include children living in families with at least one parent and children living apart from both parents. For children who do not live with at least one parent (for example, children being raised by grandparents), parental characteristics are calculated based on those of the householder and/or the householder’s spouse. Children living independently, living with a spouse, in the foster care system, or in group quarters, and children ages 14 years and under living with only unrelated adults, are excluded from analyses of parental characteristics. We would like to thank Renée Wilson-Simmons, NCCP Director, for her advice on this fact sheet and Seth Hartig for data checks and proofreading. Special thanks to Tatiana Brito for layout and production. Support for this work was provided by the Annie E. Casey Foundation.
1. United States Census Bureau, 2016 American Community Survey 1-Year Estimates (2016). Poverty Status In the Past 12 Months. Washington, DC: United States Census Bureau. Retrieved December 2017 from https://factfinder.census.gov. In this fact sheet, poverty is defined as family income less than 100 percent of the federal poverty threshold, as determined by the U.S. Census Bureau; low income is defined as family income less than 200 percent of the poverty threshold; deep poverty is defined as family income less than 50 percent of the poverty threshold.
2. The U.S. Census Bureau issues the poverty thresholds annually. Thresholds vary by family size and composition. See http://www.census.gov/data/tables/time-series/demo/income-poverty/historical-poverty-thresholds.html for the complete 2016 poverty thresholds.
3. Cauthen, N.K., & Fass, S. (2008). Measuring Income and Poverty in the United States. New York, NY: National Center for Children in Poverty, Columbia University, Mailman School of Public Health.
4. Estimates from the Economic Policy Institute’s Family Budget Calculator. Retrieved November 2016 from http://www.epi.org/resources/budget/.
5. In the most recent ACS, parents could report children’s race as one or more of the following: “White,” “Black,” “American Indian or Alaska Native,” or “Asian and/or Hawaiian/Pacific Islander.” In a separate question, parents could report whether their children were of Hispanic origin. For the data reported, children whose parent reported their race as White, Black, American Indian or Alaska Native, or Asian and/or Hawaiian/Pacific Islander and their ethnicity as non-Hispanic were assigned a non-Hispanic category of their race. Children who were reported to be of more than one race were assigned as Other. Children whose parent identified them as Hispanic were categorized as Hispanic, regardless of their reported race.
6. The variable “native-born parents” is defined to mean that both parents in the family were born in the U.S. or its territories, or born abroad to American parent(s). The variable “immigrant parents” is defined to mean that at least one parent in the family is either a U.S. citizen by naturalization or is not a citizen of the U.S.
7. Parent employment is defined as the employment level of the parent in the household who maintained the highest level of employment in the previous year. Parents can either have no employment in the previous year, part-year or part-time employment, or full-time, year-round employment. Part-year or part-time employment is defined as either working less than 50 weeks in the previous year or less than 35 hours per week. Full-time, year-round employment is defined as working at least 50 weeks in the previous year and 35 hours or more per week.
8. Parent education is defined as the education level of the most highly educated parent(s) living in the household. Parents can either have no high school degree, a high school degree but no college, or some college or more.
9. Aratani, Y. (2009). Homeless Children and Youth: Causes and Consequences. New York, NY: National Center for Children in Poverty, Columbia University, Mailman School of Public Health.
10. Hernández, D., Jiang, Y., Phillips, D., Carrión D., & Aratani, Y. (2016). “Housing Hardship and Energy Insecurity among Native Born and Immigrant Low-Income Families with Children in the United States.” Journal of Children and Poverty. 22(2): 77-92. Retrieved December 2017 from https://www.ncbi.nlm.nih.gov/pmc/articles/PMC5016025/pdf/nihms758712.pdf.
Schwartz, M., & and Wilson, E. (2008). “Who Can Afford To Live in a Home?: A look at data from the 2006 American Community Survey” Washington, DC: United States Census Bureau. Retrieved December 2017 from https://www.census.gov/housing/census/publications/who-can-afford.pdf.
11. The most recent ACS does not differentiate whether young children attend preschool or if they are attending Kindergarten or higher grades. The numbers cited above assume that children ages 3 or 4 attending school are attending preschool. Some children who are 5 years old may also be attending preschool, but have been excluded from the age range used in determining the preschool statistics cited above.
12. People can report more than one type of insurance coverage. Children who were covered by both private and public insurance were categorized as having public insurance. Children not covered by private or public health insurance at the time of the survey are considered uninsured.
Suggested Citation
Jiang, Y., & Koball, H. (2018). Basic Facts about Low-Income Children: Children under 18 Years, 2016. New York: National Center for Children in Poverty, Columbia University Mailman School of Public Health.