This is an excerpt from the full report.
Introduction
Good health in childhood both reflects and predicts full social and economic participation. Conversely, social divisions by race and income are often associated with health disparities, which inhibit children from achieving their full potential. Although many would agree that health is a fundamental right, children subject to exclusion by race and class are less likely to enjoy this right.
An earlier report in the NCCP Who are America’s Poor Children? series examined child health disparities by poverty status. In the introduction to that report two points were made. First, “the relationship between socioeconomic status and health is one of the most robust and well documented findings in social science.” Second, the relationship is also reciprocal, as poverty detracts from resources used to maintain health, while poor health detracts from the educational and employment paths to income mobility.
This report goes one step further to consider health disparities among poor children by race and ethnicity. As in the earlier report, it identifies a list of publicly available indicators found in the National Health Interview Survey (NHIS) and the National Health and Nutrition Examination Survey (NHANES). It examines selected disparities in six domains of health risk and health status: family composition and poverty, food insecurity, environmental conditions, health insurance coverage, access to healthcare services, and health outcomes.
It offers a short introduction to a dozen indicators, explaining how each reflects one of the six dimensions of heath and how public policies might help to reduce relevant disparities. Intended for a generalist audience, this report summarizes and references primary research resources.
Although the leading causes of mortality have changed over time in the most developed countries, from infectious diseases (such as tuberculosis and influenza) to chronic diseases (like heart disease, cancer, and stroke) those who are socially marginalized by race and class continue to be at substantially higher risk for poor health.
All of the children included in this analysis are poor and thus subject to the range of disadvantages associated with growing up in low-income families. Poverty is defined based on the ratio of family income to the federal poverty guideline for a family with a given composition of adults and children. This report explores differences among poor Hispanic, non-Hispanic black, and non-Hispanic white children. (For simplicity, hereafter, “poor Hispanic,” “ poor black,” and “poor white” children.)
Previous research shows that the association between poverty and health differs among these groups. The “income-health gradient,” that is, the continuous linear association between income and health across a wide spectrum of incomes, is most evident for white and black children, and less so for Hispanic and Asian children.6 Health outcomes among immigrants in general, and Hispanics in particular, are often found to be more favorable than would be predicted based on their socioeconomic status, an oft-cited anomaly sometimes referred to as the “healthy immigrant effect” or the “Hispanic paradox.”
Previous research also suggests that although there are differences in health outcomes among racial subgroups, no group always leads or falters on every indicator. It finds that health disadvantages are often greatest among Native American and black children, least severe among white and Asian children, and moderately severe among Hispanic children. Nevertheless, certain risks are more relevant for a particular group than others, (as seen below).
Since the landmark Institute of Medicine 2002 report “Unequal Treatment: Confronting Racial and Ethnic Disparities in Health Care,” several leading federal agencies have made explicit commitments to reduce disparities in healthcare quality and outcomes by race and ethnicity. The Agency for Healthcare Research and Quality (AHRQ) produces an annual National Health Disparities Report, within which a recurring finding is that although the quality of care is improving for the general population, disparities related to race, ethnicity, and socioeconomic status are not.
Reducing these disparities is an explicit goal of Healthy People 2020, an initiative coordinated by the U.S. Department of Health and Human Services. In addition, for the first time this year, HHS released its “HHS Action Plan to Reduce Racial and Ethnic Health Disparities: A Nation Free of Disparities in Health and Health Care,” outlining the ways in which the reduction of these disparities will be used as a performance outcome across a broad range of HHS initiatives.
Differences of Substantive and Statistical Significance
Often reports make a distinction between differences that are statistically significant and those that are substantively important. Differences are conventionally judged to be statistically significant if they would be observed at least 90, 95, or 99 percent of the time from many random samples drawn the population (in this case, from many surveys of poor Hispanic, black, and white families). Substantive differences rest on judgments of how large differences need be to be relevant to the analysis. If the sample size is large enough, even very small differences can be statistically significant but add little of interest to the study.
When research is based on serial datasets with consistent measures, the researcher can often combine sample sizes to ensure that differences large enough to be substantively important are statistically significant. In other words, the alignment of statistical and substantive significance is often within the researcher’s control. Researchers simply set a “minimum detectible effect” based on substantive significance and conduct a “power analysis” to determine the minimum sample size necessary to detect differences of a given size.
This report is designed to capture differences of at least six percentage points 90 percent of the time, with 90 percent confidence. In technical terms, samples were aggregated to achieve a minimum detectible effect of six percentage points, given a one-tailed test, with 90 percent power and 90 percent confidence for each indicator. What this means for the reader is that we can be confident that most differences of six percentage points or more would be observed at least 80 percent of the time. Conversely, differences of less than six percentage points are often (though not always) idiosyncratic to the survey samples drawn.
Family Composition and Poverty
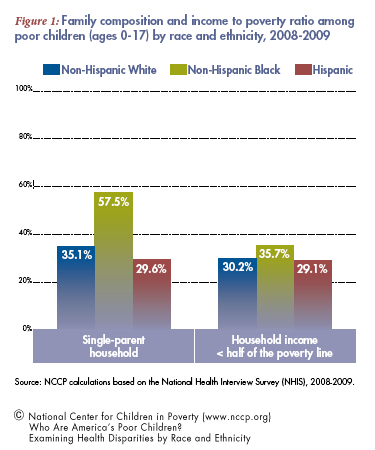
Although most children raised by single parents fare well, on average they are at greater risk of poverty as well as accompanying health, academic, and behavior problems compared to children growing up with married biological parents. The first set of columns in Figure 1 show that poor black children are substantially more likely than poor white or Hispanic children to reside in a single-parent family (58 vs. 35 and 30 percent).
Although all children included in this report live in households with incomes less than the federal poverty line (FPL), they differ with respect to how far below the FPL their households’ incomes fall. The second set of columns show that poor black children are most likely to live in households’ with incomes less than half of the FPL (36 percent vs. 30 and 29 percent).