Learn about our Social Inclusion & Respect for Diversity project.
Immigration in the United States has held a longstanding and transformative role in shaping the country’s social and economic landscape. State and local policies have, likewise, responded to the changing presence and composition of immigrants in American society. Yet, significant gaps in policies that address the unique experience of children in immigrant families still remain. As the number of children of immigrant parents increases, policies that meet their needs in areas such as education, health care, and economic security will become necessary.
Currently, 17.2 million children residing in the U.S. have a parent who is foreign-born and 4.2 million children of immigrant parents are poor. High poverty rates among children of immigrant parents, coupled with unique social and economic challenges, make them particularly disadvantaged when compared with children of native-born parents. This poses a significant policy challenge, as poverty and other material hardships can have deleterious effects on a child’s long-term health and well-being. More importantly, as this brief suggests, children of immigrant parents experience poverty that is different from poor children of native-born parents. For example, poor children of immigrant parents are more likely than their native-born counterparts to live in households where at least one parent works full-time, year-round. Moreover, poor children of immigrant families are less likely to receive food stamps than poor children of native-born parents. These findings suggest that child poverty in immigrant families is not necessarily linked to joblessness; rather, it is more closely connected to low-wage work and barriers to valuable work supports. Examining the landscape of poverty among children of immigrant parents will help to identify policy interventions that support healthy development and long-term economic security.
Research suggests that children not only differ by the nativity of their parents (native- versus foreign-born), but that children of immigrant parents are themselves a diverse population. Studies show that duration of stay within the U.S. plays a critical role in determining long-term health well-being among children of immigrant parents. This brief takes into consideration the diversity among children of foreign- born parents by not only considering whether parents were born in the U.S. or abroad, but by also considering how long foreign-born parents have resided in the U.S. This is an important distinction when examining differences among children by parents’ nativity.
Thus, the purpose of this brief is to examine differences among children of native-born parents, children of recent immigrant families, and children of established immigrant families across a range of socio-demographic characteristics. Promoting positive outcomes for young children in immigrant families requires a deeper understanding of the population itself. To this end, the brief provides a more nuanced look at poor children living with immigrant parents by expanding the definition of the immigrant experience to include not only parents’ nativity but also their duration of stay in the U.S.
Data and Definitions
Unless otherwise noted, all estimates are based on the 2006 and 2009 American Community Survey (ACS) Public Use Microdata Sample (PUMS) files. Estimates include children under age 18 living in households with at least one parent and most children living apart from both parents (for example, children being raised by grandparents). Children living independently, living with a spouse, or in group quarters are excluded from these data. Children ages 14 and under living with only unrelated adults were not included because data on their income status were not available. Among children who do not live with at least one parent, parental characteristics are those of the householder and/or the householder’s spouse.
The immigration experiences of children’s parents are defined using parents’ nativity and calculated duration of stay in the U.S., which is based on their current age at the time of the survey and the year the parent(s) reported coming to the United States.
- Native born – Children living with parents who are native-born include all children whose parents were born in the United States, Puerto Rico, in U.S. territories, or abroad to U.S. citizens.
- Established immigrant – Children with established immigrant parents include those with parent(s) who are foreign born and have resided in the United States for at least 10 years.
- Recent immigrant – Children with recent immigrant parents include those with parents who are foreign born and who have lived in the U.S. for less than 10 years.
- Mixed immigration – Children with parents who have different immigration experiences (such as having both a native-born and established immigrant parent or having both a recently immigrated and established immigrant parent) are included in a mixed immigrant category and retained for part of the analyses presented in this brief.
All estimates are weighted using the appropriate person-level weight.
How many children live in families with immigrant parents?
The percentage of children living with immigrant parents is on the rise.
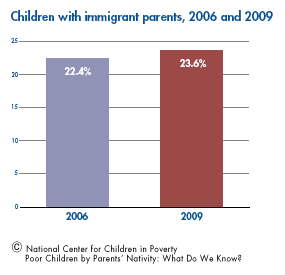
Both the number of children with immigrant parents and their share of the child population has increased over time. Approximately 24 percent of children under age 18 live with immigrant parents in 2009, an increase from 22 percent in 2006. In terms of numbers, children with immigrant families have increased seven percent from 16.1 million in 2006 to 17.2 million in 2009.
A majority of children in immigrant families have at least one parent who has resided in the U.S. for 10 or more years.
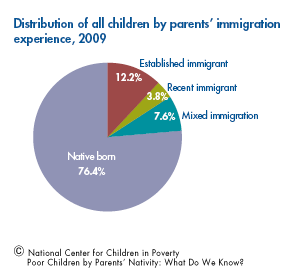
- 76.4 percent of all children – 55.8 million – live with native-born parents.
- 12.2 percent of all children – 8.9 million – live with established immigrant parents.
- 3.8 percent of all children – 2.8 million – live with recent immigrant parents.
- 7.6 percent of all children – 5.6 million – live with parents of mixed immigration experiences.
The poverty rate is highest among children with parents who recently arrived in the U.S.

- 18.2 percent of children with native-born parents – 10.2 million – are poor.
- 27.2 percent of children with parents who are established immigrants – 2.4 million – are poor.
- 38.5 percent of children with parents who are recent immigrants – 1.1 million – are poor.
What are the characteristics of poor children in immigrant families?
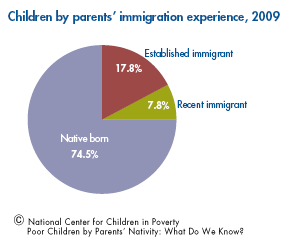
- 74.5 percent of poor children –10.2 million – have native-born parents.
- 17.8 percent of poor children – 2.4 million – have parents who are established immigrants.
- 7.8 percent of poor children – 1.1 million – have parents who are recent immigrants.
An overwhelming majority of poor children in both established and recent immigrant families are of Hispanic origin.
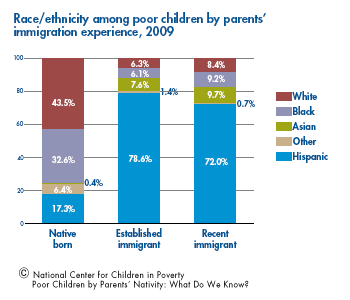
Although white and black, non-Hispanic children represent two of the largest shares of poor children in native-born families – 43.5 and 32.6 percent, respectively, children of Hispanic origin make up an overwhelming majority of poor children in foreign-born families. More than three-quarters (78.6 percent) of poor children in established immigrant families and 72 percent of poor children in recent immigrant families are of Hispanic origin.
High school completion and some college education are more common among the native-born parents of poor children.
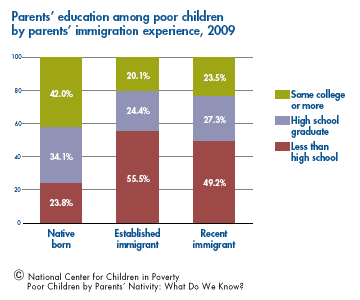
- 76.1 percent of poor children in native-born families – 7.7 million – have parents with at least a high school degree.
- 44.5 percent of poor children in established immigrant families – 1.1 million – have parents with at least a high school degree.
- 50.8 percent of poor children in recent immigrant families – 0.5 million – have parents with at least a high school degree.
Established immigrant parents of poor children exhibit the strongest attachment to the labor force.
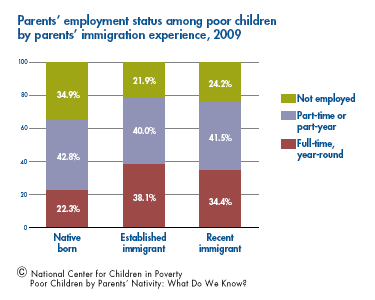
- 65.1 percent of poor children in native-born families – 6.6 million – have at least one parent who is employed.
- 78.1 percent of poor children in established immigrant families –1.9 million – have at least one parent who is employed.
- 75.9 percent of poor children in recent immigrant families – 0.8 million – have at least one parent who is employed.
Marriage is most common among recent immigrant parents of poor children.
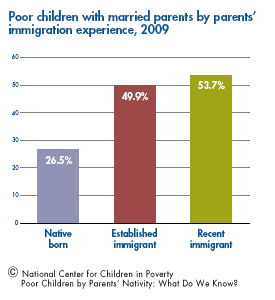
- 26.5 percent of poor children in native-born families – 2.7 million– have married parents.
- 49.9 percent of poor children in established immigrant families –1.2 million – have married parents.
- 53.7 percent of poor children in recent immigrant families – 0.6 million – have married parents.
Poor children in established immigrant families appear to be the most residentially stable.
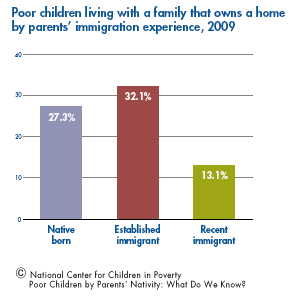
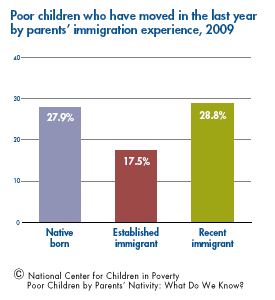
Poor children in established immigrant families are more likely than their counterparts to live in a family that owns a home. They are also the least likely to have moved in the last year.
- 27.3 percent of poor children in native-born families – 2.8 million – live with a family that owns a home.
- 32.1 percent of poor children in established immigrant families – 0.8 million – live with a family that owns a home.
- 13.1 percent of poor children in recent immigrant families – 0.1 million – live with a family that owns a home.
- 27.9 percent of poor children in native-born families – 2.8 million – moved in the last year.
- 17.5 percent of poor children in established immigrant families – 0.4 million – moved in the last year.
- 28.8 percent of poor children in recent immigrant families – 0.3 million – moved in the last year.
How does the distribution of immigrant families vary by geography?
Poor children in foreign-born families are more likely to reside in an urban area.
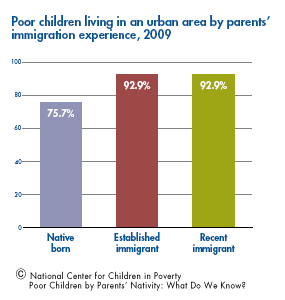
Figure 11: Poor children living in an urban area by parents’ immigration experience, 2009
While three-quarters of poor children in native-born families live in an urban area, nine out of 10 children in foreign-born families, regardless of parents’ duration of stay, are urban residents.
- 75.7 percent of poor children in native-born families – 7.1 million – lived in an urban area.
- 92.9 percent of poor children in established immigrant families – 2.2 million – lived in an urban area.
- 92.9 percent of poor children in recent immigrant families – one million – lived in an urban area.
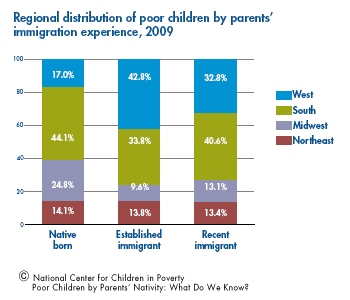
Poor children living in foreign-born families, regardless of duration of stay in the U.S., are heavily concentrated in the southern and western regions of the United States.
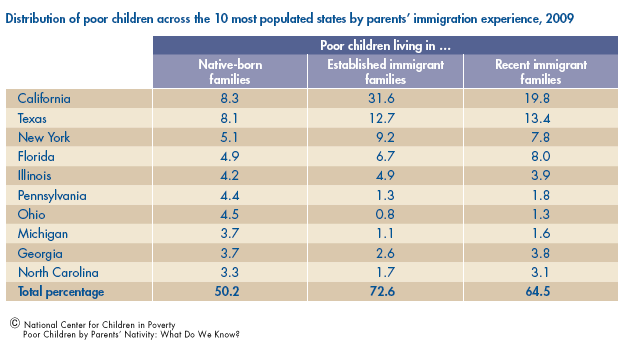
The geographic distribution of poor children in native-born families is more dispersed than that of children in foreign-born families. In addition, about 50 percent of the poor children in native-born families reside in the 10 most populated states compared with nearly two-thirds to three-quarters of poor children in foreign born families.
What are the hardships experienced by poor children in immigrant families?
Lacking health insurance and access to food stamps is highest among poor children in recent immigrant families.
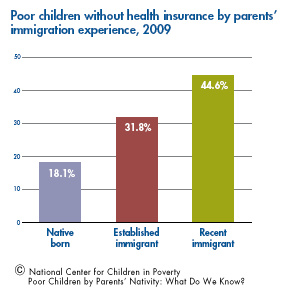
Poor children in recent immigrant families are the most likely to be uninsured, followed by poor children in established immigrant and native-born families.
- 18.1 percent of poor children in native-born families – 1.8 million – were uninsured.
- 31.8 percent of poor children in established immigrant families – 0.8 million – were uninsured.
- 44.6 percent of poor children in recent immigrant families – 0.5 million – were uninsured.
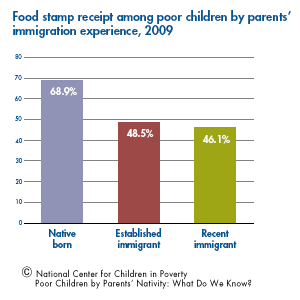
In addition, less than one-half of poor children in recent immigrant families receive food stamps compared with more than two-thirds of poor children in native-born families.
- 68.9 percent of poor children in native-born families – seven million—received food stamps.
- 48.5 percent of poor children in established immigrant families – 1.2 million – received food stamps.
- 46.1 percent of poor children in recent immigrant families – 0.5 million – received food stamps.
Endnotes
1. Duncan, Greg J.; Brooks-Gunn, Jeanne. 1997. Consequences of Growing up Poor. New York: Russell Sage Foundation. Currie, J.; W. Lin. 2007. Chipping Away at Health: More on the Relationship between Income and Child Health. Health Affairs 26(2): 331-344.
Duncan, G. J.; A Kalil and K. Ziol-Guest. 2008. The Economic Costs of Early Childhood Poverty. Washington, DC: Partnership for America’s Economic Success.
Magnuson, K.; E. Voturba-Drazal. 2009. Enduring Influences of Child Poverty. Focus 26(2): 32-37.
2. Bates, Lisa M; Teitler, Julien. O. 2008. Immigration and Low Birthweight in the US: The Role of Time and Timing. Paper presented at PAA Annual Meeting, New Orleans, LA.
Myers, Dowell; Gao, Xin; Emeka, Amon. 2009. The Gradient of Immigrant Age-at-arrival Effects on Socioeconomic Outcomes in the U.S. International Migration Review 43(1): 205-229.
3. For the remainder of analyses presented in this factsheet, we limit our analysis to children living with native-born and established and recent immigrant parents. Children living with foreign born parents who have mixed immigration experiences (i.e., one parent who is established and one parent who is a recent arriver) are excluded.
4. In the most recent ACS, parents could report children’s race as one or more of the following: “White” “Black,” “American Indian or Alaskan Native,” or “Asian and/or Hawaiian/Pacific Islander.” In a separate question, parents could report whether their children were of Hispanic origin. For the data reported, children whose parent reported their race as White, Black, or Asian Native Hawaiian/Other Pacific Islander and their ethnicity as non-Hispanic are assigned their respective race. Children who were reported to be American Indian/Alaskan Native, of some other race, or of more than one race were assigned as Other. Children whose parent identified them as Hispanic were categorized as Hispanic, regardless of their reported race.
5. Estimates on area of residence are based on children for whom urban/rural status could be determined.