Learn about our Making Work Supports Work project.
Introduction
Increasingly the significance of asset ownership among low-income families is being recognized. Assets such as savings and homeownership are vital components of a family’s economic security, along with income and human and social capital. In this report, we use the term “assets” to refer to financial and economic resources, not including human capital. Unlike labor market earnings, income generated from assets provides a cushion for families in case of job loss, illness, death of a parent, or even natural disaster. This cushion may be especially important for the working poor, whose economic lives can be severely impacted by even short periods of unemployment. Asset ownership can also have long-term consequences for children. Research shows parental financial assets such as savings are positively associated with the cognitive development of school-age children. Homeownership is also known to have a positive effect on high school graduation. There are two major ways in which assets positively benefit children. First, housing assets can be seen as a proxy for the quality of residence. Homeownership provides residential stability, and the market value of homes often indicates the quality of school that children attend. Secondly, financial assets are potential resources for a family to invest in children. They can be used for sending children to preparatory schools or financing a college education. Thus, family assets can positively promote children’s well-being and educational achievements.
Family assets are particularly important for low-income families; however, the prospects are not particularly bright for building their assets. Given limited incomes, many low-income families often struggle to make ends meet and save. Between 1984 and 2001, the level of debt increased substantially among low- and moderate-income families, and the majority of low-income families experienced having family debt greater than or equal to 40 percent of total family income. Further, the bankruptcy rate among middle-class families has increased; and African-American and Hispanic middle class families are more likely to file for bankruptcy than their White middle class counterparts. This research brief investigates the status of asset ownership and debt among families with children aged birth to 18, using the Panel Study of Income Dynamics (PSID) 2001 and 2007 data. It also examines disparities in asset holdings and debt by race and gender of family heads as well as age of children in the family. As asset holdings and debt can impact the well-being of children, in this report we examine the economic security of families with children based on family asset holdings and debt. First, we explore the concept of asset poverty and estimate the proportion of families who are asset poor, followed by the examination of debt and financial assets of families with children. The report concludes with policy implications and recommendations to promote the financial security of families with children.
Asset Poverty vs. Income Poverty
While family income is often used as the primary determinant in calculating poverty, a poverty status based on family assets provides a different picture of economic security for American families. The definition of asset poverty was initially proposed to determine the amount of assets needed for a family to meet its basic needs over a specified period of time under an extreme condition, when no other sources of income are available. Asset poverty takes into account how much a family would need to make ends meet, absent an income generating job for 3 months. This is important to measure because the consequences of financial hardship include the detrimental impact on children’s development and well-being. Tying into the official U.S. poverty level for a specific family size, asset poverty is measured based on the amount of assets that are needed to live at the poverty level for three months – 25 percent of the annual federal poverty level (FPL). For example, in 2007, the official U.S. poverty level was $20,650 for a family of four. For this family to survive at the poverty level under the extreme condition of having no other source of income for three months, they would need $5,162 in assets. Hence, an examination of assets and debt provides a new perspective on the economic security of families with children.
There are different ways to measure asset poverty. In this report, the following three measurements are used: (1) total family net worth, including home equity below 25 percent of federal poverty level; (2) total financial net worth, excluding home equity below 25 percent of federal poverty level; and (3) liquid assets below 25 percent of the federal poverty level. The detailed composition of each measurement is described in the box below. Total family net worth is defined as the current value of all assets, minus the current value of debts and the value of vehicles. The net worth is the total amount of assets, which reflects economic well-being of families. The second estimate of asset poverty is based on a more restrictive definition of assets. Since most families would rather not sell their home to meet their consumption needs, subtracting home equity from total net worth may better describe how families realistically cope during an extreme circumstance. Finally, liquid assets only include immediately available assets that can be easily converted to cash. This includes savings and other financial investments.
| Composition of Asset Poverty Measurements | ||
| 1. Total Net Worth | 2. Financial Net Worth (Net Worth Minus Home Equity) | 3. Liquid Assets |
| + Home equity | + Value of owned business | + Value of checking/saving |
| + Value of owned business | + Value of checking/saving | + Value of stocks |
| + Value of other real estate | + Value of other real estate | + Value of bonds, cash value in a life-insurance, a valuable collection of investment purposes, etc. |
| + Value of bonds, cash value in a life-insurance, a valuable collection of investment purposes, etc. | + Value of stocks | |
| – Net of debt value | + Value of bonds, cash value in a life-insurance, a valuable collection of investment purposes, etc. | |
| – Value of vehicle | – Net of debt value | |
| – Home equity | ||
| – Value of vehicle | ||
| Note: + (plus) signs indicate included values and – (minus) signs indicates excluded values. | ||
More than Half of Families with Children are Asset Poor
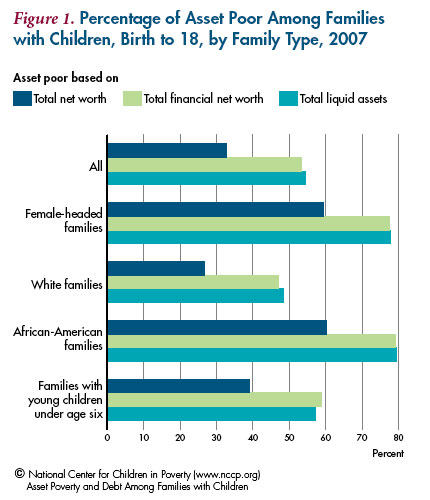
Based on the three measurements of asset poverty, we first looked at the status of asset poverty for all families with children under age 18 and by family characteristics. Figure 1 shows the vulnerability of American families with children. Overall when asset poverty is measured including housing assets, only about one-third of families with children are considered to be asset poor. However, this status varies considerably by family type, and our findings indicate that a majority of African-American children and 60 percent of children in female-headed families grow up asset poor. Further, when looking at asset poverty based on financial net worth or liquid assets, more than half of all families with children are categorized as asset poor (52 percent). In fact, close to two-thirds or more of female headed (77%), African-American families (80%) or families with young children (60%) also lack sufficient liquid assets to cope with everyday needs during financially challenging times. This indicates that the majority of children of African-American, female-headed or families with young children are precariously close to falling below the federal poverty level if their families ever experience a loss of income from earnings such as in the event of parental unemployment or illness.
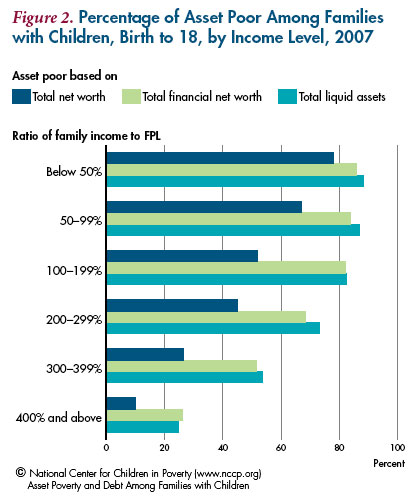
Figure 2 shows the percentages of asset-poor families by ratio of family income to the federal poverty level. There is a large overlap of poverty based on both income and asset measures with the majority of poor (under 100 percent of FPL) and low-income families (under 200 percent of FPL) also being asset poor. This asset poverty measurement also reveals that even those considered to be middleincome families (incomes at between 200 and 299 percent of poverty and over half between 300 and 399 percent of FPL) are also asset poor based on their financial net worth or liquid assets. Hence, if a middle-income family loses its income source due to a job lay-off, illness, death of a parent, or natural disaster, the children of that family are likely to fall into poverty. While these middle-income families are much less likely to be asset poor based on their total net worth, this is largely due to their home equity. Even if a family sells their home, most would need to use the proceeds to lease or buy a replacement home. Given the current economic crisis, it is possible that those middle-income families with children whose parents lost jobs are struggling to make ends meet and live above the poverty level.
Vulnerable Families are Often Without Bank Accounts
A large proportion of low-income families, especially African-American and female-headed families, are without bank accounts. Having savings and other liquid assets can accommodate familial needs during unexpected events. For example, it has been reported that families in New Orleans who were trapped in their homes after Hurricane Katrina hit did not listen to warnings to leave because they were reluctant to abandon their assets, which was largely based on consumer goods. In general, a bank account can play three important roles: (1) to convert checks into cash; (2) to function as a payment system to third parties; and (3) to provide security by eliminating the necessity of carrying a large amount of cash. Those who do not have a bank account use alternative financial services such as check-cashing outlets (CCOs), pawnshops, payday lenders, and rent-to-own shops. Among low-income families, reasons for not having a bank account include the scarcity of bank branches in neighborhoods, poor credit ratings that prevent them from obtaining accounts, and the availability of lower-cost services by non-banks. Historically, many low-income neighborhoods had limited access to mainstream financial services due to concerns about profitability and discriminatory redlining policies of financial institutions. Most poor, minority neighborhoods are now served by traditional banks but also contain disproportionate numbers of alternative financial service providers. However, having a bank account provides lowincome families with not only a cushion against budget shocks and income instability but also a secure place to save and accumulate interest, and a means for home purchase.
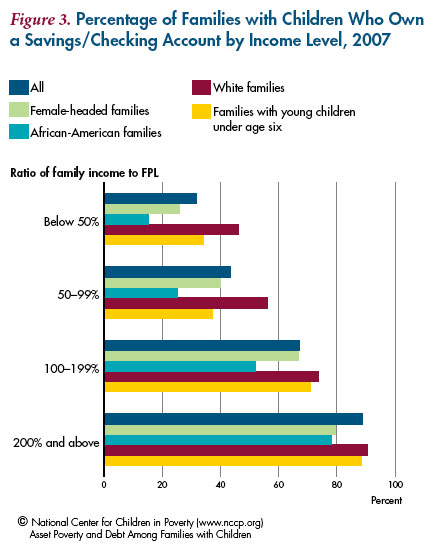
Figure 3 shows the percentage of families who held checking or savings accounts by income level as well as race, gender of family’s head and the age of children in the family. There is considerable disparity within the same income level depending on the family type. Among all families who live in extreme poverty (incomes below 50 percent of FPL), overall, only one-third of families have a bank account (32 percent). However, rates of bank account ownership also vary by family type. For example, within this income group, nearly half of white families have bank accounts while only 15 percent of African- American families and 26 percent of female-headed families. In fact, the majority of white families hold a savings/checking account at nearly all income levels, while among African-American families, it is not until income is above 200 percent of FPL that well over half of families own a bank account.
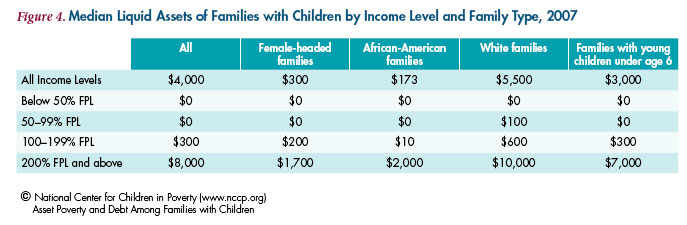
Figure 4 shows the median liquid assets of families by income level and family type. Despite having checking and savings accounts, the median liquid assets of families with limited incomes are low. Among poor families (incomes below 100 percent FPL), only white-headed households at 50 to 99 percent FPL have median liquid assets greater than $0. It is not until families have incomes at 200 percent FPL and greater, are median liquid assets levels in the thousands. Among all family types, those with a white head of household have the highest levels of median liquid assets at all income levels.
Vulnerable Families Owe More than They Earn: Debt and Debt Hardship
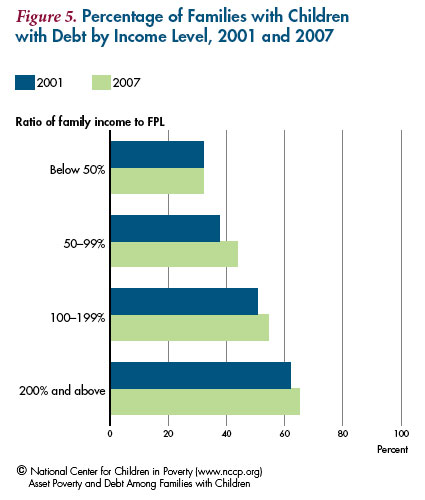
In addition to not having enough assets to weather short-term crises, many families have significant amounts of debt. The burden of debt can not only be an obstacle to saving, but it can also impact a family’s psychological well-being. Research shows that debt is highly associated with one’s mental health, and family debts can have a potentially negative impact on children’s emotional wellbeing. Figure 5 shows the percentage of families with debt by income level. The debt reflected in this figure includes credit card balances, student loans, medical or legal bills, or loans from relatives. Home or car loans are not included in this figure. Between 2001 and 2007, overall the percentage of families with debt increased. Within these years, as income increased the proportion of families with debt has increased as well. At the lower end of the income spectrum, nearly a third of families with incomes below 50 percent FPL have debt. Families with incomes at 200 percent FPL and above have nearly twice the rate of debt. However, it is important to note that having debt does not always have negative implications for families. By itself, debt is an ambiguous indicator of family economic wellbeing for two reasons. In some cases, families use debt to achieve higher income, for example taking out student loans to finance higher education and improve their earning potential. In addition, regardless of how families use debt, the fact that they are approved for loans to some extent reflects their credit-worthiness in the eyes of lenders. At the same time, individuals with bad credit and a poor track record of managing finances often have a more difficult time acquiring bank loans.
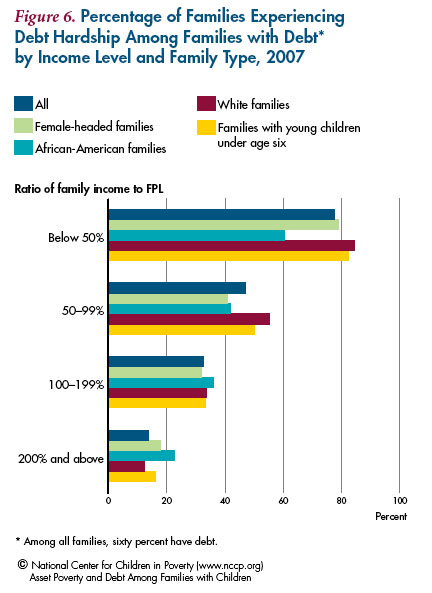
Debt hardship – a measure of excessive debt – is defined as a total family debt greater than or equal to 40 percent of total family income. Figure 6 shows the proportion of families experiencing debt hardship by race and gender of the head and age of children in the family. Overall, more than 75 percent of families under 50 percent FPL are facing debt hardship, and as income level increases, the rate of hardship declines considerably. Further, it was found that among families whose incomes are below 100 percent of FPL, white families were most likely to experience debt hardship. Conversely,white families in the highest income group were least likely to experience debt hardship compared with other groups.
Summary of Main Findings
This report has found:
- More than half of American families with children are asset poor based on their financial assets, and in particular, more than two-thirds of African-American families and female-headed families are asset poor.
- The percent of families with debt is increasing.
- Approximately a half or more poor families with children (under 100 percent of FPL) are experiencing debt hardship.
- Less than half of poor families with children (income under 100 percent of FPL) own a bank account.
Policies That Can Help
There are several promising policies and initiatives that promote the economic security of asset-poor families.
- The Reduction and/or Elimination of Asset Tests. Many states have chosen to reduce or eliminate asset tests in work support programs. Ohio and Virginia, for example, are the most progressive states on this matter and have eliminated TANF asset limits to help recipients achieve self-sufficiency. Although they have not eliminated asset limits completely, Colorado, Illinois and California reformed their asset rules through increases in the amount of cash resources and exemptions for certain forms of assets. The reduction or elimination of asset tests for the major means-tested benefit programs could protect the limited assets that low-income families have.
- Asset Building Programs among Low-Income Families. Programs that help families accumulate liquid assets can play an important role to further increase the economic security of families with children. Currently, the Individual Development Accounts (IDA) program has been implemented to help asset-poor families build financial assets. While programs vary, one promising example allows participants to save up to $1,000 (a maximum of $125 savings per month); and savings are matched 2:1, so up to $1,000 of savings can be matched with $2,000 for a total of $3,000 in savings. IDAs are often designed for specific purposes such as buying a home, starting businesses or furthering education. However, assisting asset-poor families to open bank accounts where families can control its usage could be also helpful. In addition, providing incentives, such as matching within programs, can promote savings and reinforce messages about the importance of savings. Saving for Education, Entrepreneurship, and Downpayment (SEED) national initiative is another promising program which has been implemented since 2003. This policy, practice and research initiative is coordinated by six national partners including the Corporation for Enterprise Development (CFED) and is designed to test the efficacy of saving accounts for children and youth. In SEED, nonprofit community organizations establish subsidized, matched accounts known as Child Development Accounts (CDAs) for low- and moderate-income children and youth. Based on the evaluation of CDAs, studies have shown positive impacts on families, such as parents and children developing saving habits, higher educational aspirations, and increased expectations for college attendance. Additionally, financial education, a component of many CDA initiatives, can increase savings rates by expanding individuals’ understanding of the process and benefits of asset accumulation; those who comprehend the advantages may be more willing to save. A recent study found that families with more assets are less likely to experience material hardship than families who are asset poor in event of job loss.
- Comprehensive Health Care Insurance. There is evidence that increasing access to comprehensive health care insurance has the potential to decrease debt among income- and assetpoor families. In 2007, 72 million people, or 28 percent of the U.S. population reported having problems paying their medical bills or were paying off accrued medical debt during the past year. This number has increased significantly from 58 million people in 2005. Based on a national survey in 2007, 62.1 percent of all bankruptcies were attributed to medical problems – an increase of about 50 percent from 2001 – and 92 percent of debtors with medical debts had medical debts over $5,000, or 10 percent of pretax family income. Hence, without comprehensive healthcare programs, debt among low-income and low-asset families will probably continue to increase.
- Unemployment Insurance Reform. There has been “unprecedented” state unemployment insurance (UI) reform as a result of the American Recovery and Reinvestment Act (ARRA), which was signed into law by President Obama. While this may be a short-term and temporary system reform, the seven-billion dollar assistance in federal incentive funds resulted in waves of state insurance reforms adding coverage for more workers than were traditionally covered under the unemployment system. The rates of UI receipt among lowwage or part-time unemployed workers had been significantly lower due to the previous eligibility rules. The $7 million in ARRA funds will allow states to expand the UI eligibility rules that previously disqualified low-wage, part-time workers or those with sporadic work histories. Already, 33 states and the District of Columbia are reforming their UI system and these reforms will help income- and asset-poor families with children in the event of parental unemployment.
- Financial Literacy Programs for Youth. Financial institutions and the government have an obligation to promote financial literacy, and it is important to start at an early age. In 2008, former President George W. Bush established the President’s Advisory Council on Financial Literacy. One of the council’s initiatives included financial literacy for youth. This initiative is also supported by the Obama administration through the collaboration of the U.S. Treasury and Education Departments. As the first step of the initiative, the National Financial Capability Challenge is designed to increase the financial knowledge and capability of high-school age youth across the United States. The program encourages schools and teachers to incorporate the financial education into their curricula and also challenges students to learn more about personal finance. Other educational and financial programs have sought to help low-income youth transitioning to adulthood – especially those in child welfare and juvenile justice systems – acquire skills in finance and accounting. These type of educational programs could help youth to make conscientious financial choices and take control of their financial futures.
Conclusion
The findings of this report expose the economic vulnerability of American families with children, which is masked by the conventional income measure. Children of low-income as well as of middle-income families are economically vulnerable in the events of unemployment, illness, death of a parent, or natural disaster. In particular, since the start of the recession in December 2007, the number of unemployed individuals has increased by more than seven million to 15.4 million, making the current unemployment rate 10.0 percent overall. The unemployment rate is even higher among blue-collar workers or those with non-professional jobs, which makes low-income families particularly vulnerable to layoffs. Given the lack of assets among families with children, it is possible that more children face the possibility of falling below the poverty level if parents lose their jobs. As the U.S. government has historically encouraged homeownership, today, the majority of American families largely rely on housing assets and have limited liquid assets. However, it has been reported that minority homeowners are at greater risk of filing for bankruptcy than their white counterparts. As of July 2009, more than 360,000 U.S. properties were reported for foreclosure filings during the month, which is a 32 percent increase from July 2008. Hence, while supporting homeownership is important, helping families build liquid assets will be an important step to solidifying the economic security of American families with children.
Endnotes
1. Shapiro, Thomas M.; Wolff, Edward N. 2001. Assets for the Poor : The Benefits of Spreading Asset Ownership. New York: Russell Sage Foundation.
2. Cauthen, Nancy K. 2002. Policies That Improve Family Income Matter for Children. New York, NY: National Center for Children in Poverty, Columbia University Mailman School of Public Health.
3. Spilerman, Seymour. 2000. Wealth and Stratification Processes. Annual Review of Sociology 26: 497-524.
4. Yeung, W. J.; Conley, Dalton. 2008. Black–White Achievement Gap and Family Wealth. Child Development 79(2): 303-324.
5. Aaronson, Daniel, 2000. A Note on the Benefits of Homeownership. Journal of Urban Economics 47: 356-369.
7. Haurin, Donald R.; Brasington, David. 1996. Social Quality and Real House Prices: Inter- and Intrametropolital Effects. Journal of Housing Economics 5: 351-368.
8. Oliver, Melvin L.; Shapiro, Thomas M., 1995. Black Wealth/ White Wealth : A New Perspective on Racial Inequality. Routledge, New York.
9. Beverly, Sondra G.; Sherraden, Michael. 1999. Institutional Determinants of Saving: Implications for Low-Income Households and Public Policy. Journal of Socio-Economics 28(4): 457-473.
10. Wagmiller, Robert 2003. Debt and Assets Among Low-Income Families. New York, NY: National Center for Children in Poverty, Columbia University Mailman School of Public Health.
11. Warren, Elizabeth. 2004. The Economics of Race: When Making It To The Middle Is Not Enough. Washington and Lee Law Review 61(4): 1777-1799.
12. Since PSID has a very small sample of Hispanics in 2001 and 2007 data, separate analyses for Hispanics were not conducted. All the results are weighted using family weights.
13. Haveman, Robert; Wolff, Edward N. 2001. Who Are the Asset Poor? Levels, Trends, and Composition, 1983-1998. Institute for Research on Poverty. http://www.irp.wisc.edu/ publications/dps/pdfs/dp122701.pdf (accessed Aug, 14, 2009).
Haveman, Robert; Wolff, Edward N. 2005. The Concept and Measurement of Asset Poverty: Levels, Trends and Composition for the U.S., 1983–2001. Journal of Economic Inequality 2(2): 145-169.
See Endnote 8.
Shapiro, Thomas M. 2004. The Hidden Cost of Being African American : How Wealth Perpetuates Inequality. New York: Oxford University Press.
14. See Haveman et al., 2001 in Endnote 13.
15. Haveman and Wolff excluded the value of vehicles that are owned from net worth since most families, in particular low-income families largely rely on their cars for work-related transportation, and a vehicle would not be available for sale to meet immediate consumption needs.
16. See Haveman et al., 2001 in Endnote 13.
18. Alter, Jonathan. The Other America. 2005. from http://www. newsweek.com/id/104467 (accessed Aug. 14, 2009).
19. Perez, James M. Blacklisted: The Unwarranted Divestment of Access to Bank Accounts. From http://papers.ssrn.com/sol3/ papers.cfm?abstract_id=846064 (accessed Aug. 14, 2009).
21. Berry, Christopher. 2004. To Bank or Not to Bank? A Survey of Low-Income Households. Joint Center for Housing Studies, Harvard University. http://www.jchs.harvard.edu/publications/ finance/babc/babc_04-3.pdf (accessed Aug. 14, 2009). In this report, Berry found that despite previous claims, very few unbanked individuals listed scarcity of bank branches as a reason for not having an account.
22. Dunham, Constance R. 2001. The Role of Banks and Nonbanks in Serving Low- and Moderate- Income Communities. Proceedings 2001(April): 31-58.
23. Benjamin, Lehn; Rubin, Julia S.; Zielenbach, Sean. 2004. Community Development Financial Institutions: Current Issues and Future Prospects. Journal of Urban Affairs 26(2): 177-195.
24. Sawyer, Noah; Temkin, Kenneth. 2004. Analysis of Alternative Financial Service Providers. Urban Institute. http://www. urban.org/publications/410935.html (accessed Jan. 20, 2009).
25. Belsky, Eric; Calder, Allegra. 2004. Credit Matters: Low- Income Asset Building Challenges in a Dual Financial Service System. Joint Center for Housing Studies, Harvard University. February 2004. http://www.jchs.harvard.edu/publications/ finance/babc/babc_04-1.pdf
26. Jenkins, Rachel; Bhugra, Danesh; Bebbington, Paul; Brugha, Traolach; Farrell, M.; Coid, J.; et al. 2008. Debt, Income and Mental Disorder in the General Population. Psychological Medicine 38(10): 1485-1493.
27. This is based on the questionnaire design of the Panel Study of Income Dynamics, and one could argue that we should include car loans; however, those without cars also incur transportation costs.
28. For example, Bradford (2003) found that low-income, lowwealth African-American families own fewer credit cards and other non-collateralized debt than their white counterparts and suggests that this is either due to the lower demand for such debt or being biased against by lenders.
Bradford, William D. 2003. The Savings and Credit Management of Low-Income, Low-Wealth Black and White Families. Economic Development Quarterly 17(1): 53-74.
29. Venner, Sandra. 2005. Innovative State Policies to Reduce Poverty and Expand the Middle Class. Institute on Assets and Social Policy: The Heller School of Social Policy and Management, Brandeis University.
Rand, Dory. 2007. Reforming State Rules on Asset Limits: How to Remove Barriers to Saving. Clearinghouse Review: Journal of Poverty Law and Policy 40(11-12): 625-636.
32. CFED. 2008. SEED: Why Children’s Development Accounts? From http://cfed.org/assets/pdfs/caseforCDAs_ webversion.pdf (accessed Jan. 27, 2009).
34. McKernan, Signe-Mary, Ratcliffe; Caroline, Vinopal; Katie. 2009. Do Assets Help Families Cope with Adverse Events? The Urban Institute. Brief 10. From http://www.urban.org/UploadedPDF/ 411994_help_family_cope.pdf (accessed Feb. 1, 2010).
35. Collins, Sara R.; Kriss, Jennifer L.; Doty, Michelle M.; Rustgi, Sheila D. 2008. Losing Ground: How the Loss of Adequate Health Insurance Is Burdening Working Families—Findings from the Commonwealth Fund Biennial Health Insurance Surveys, 2001–2007. The Commonwealth Fund. August 2008. http://www.commonwealthfund.org/Content/Publications/ Fund-Reports/2008/Aug/Losing-Ground–How-the-Loss-of- Adequate-Health-Insurance-Is-Burdening-Working-Families– 8212-Finding.aspx (accessed Aug. 14, 2009).
36. Himmelstein, David U.; Thorne, Deborah; Warren, Elizabeth; Woolhandler, Steffie. 2009. Medical Bankruptcy in the United States, 2007: Results of a National Study. The American Journal of Medicine 122(8): 741-746.
37. National Employment Law Project. Federal Stimulus Funding Produces Unprecedented Wave of State Unemployment Insurance Reforms. 2009. http://www.nelp.org/page/-/ UI/UIMA.Roundup.June.09.pdf?nocdn=1 (accessed Aug. 14, 2009).
38. United States Government Accountability Office. 2007. Unemployment Insurance: Low-Wage and Part-Time Workers Continue to Experience Low Rates of Receipt. http://www.gao. gov/new.items/d071147.pdf (accessed Aug. 14, 2009).
41. The Department of Treasury. 2008. President’s Advisory Council on Financial Literacy: 2008 Annual Report to the President. Washington, DC. From http://www.jumpstartcoalition. org/PACFL_ANNUAL_REPORT_1_16_09.pdf (accessed Feb. 9, 2010).
42. The Department of Treasury. 2009. National Financial Capability Challenge. Washington, DC. From http://www.challenge. treas.gov/ (accessed Feb. 9, 2010).
43. Johnson, Patricia, California Council on Youth Relations. Feb. 4, 2010. Personal Communication.
44. U.S. Department of Labor. Employment Situation Summary – November 2009. From http://www.bls.gov/news.release/ empsit.nr0.htm (accessed Dec. 21, 2009)
45. U.S. Department of Labor. Employment Situation Summary- May 2009. From http://www.bls.gov/news.release/ archives/empsit_06052009.pdf (accessed Aug. 14, 2009).
47. RealtyTrac. U.S. Foreclosure Activity Increases 7 Percent in July. 2009. From http://www.realtytrac.com/ContentManagement/ PressRelease.aspx?ItemID=7192 (accessed Aug. 13, 2009).